Menu
Documentation Grafana Enterprise Metrics
Manage
Monitor
Monitor Mimir
Viewing dashboards
Writes networking
Grafana Enterprise Metrics
Manage
Monitor
Monitor Mimir
Viewing dashboards
Writes networking
Enterprise
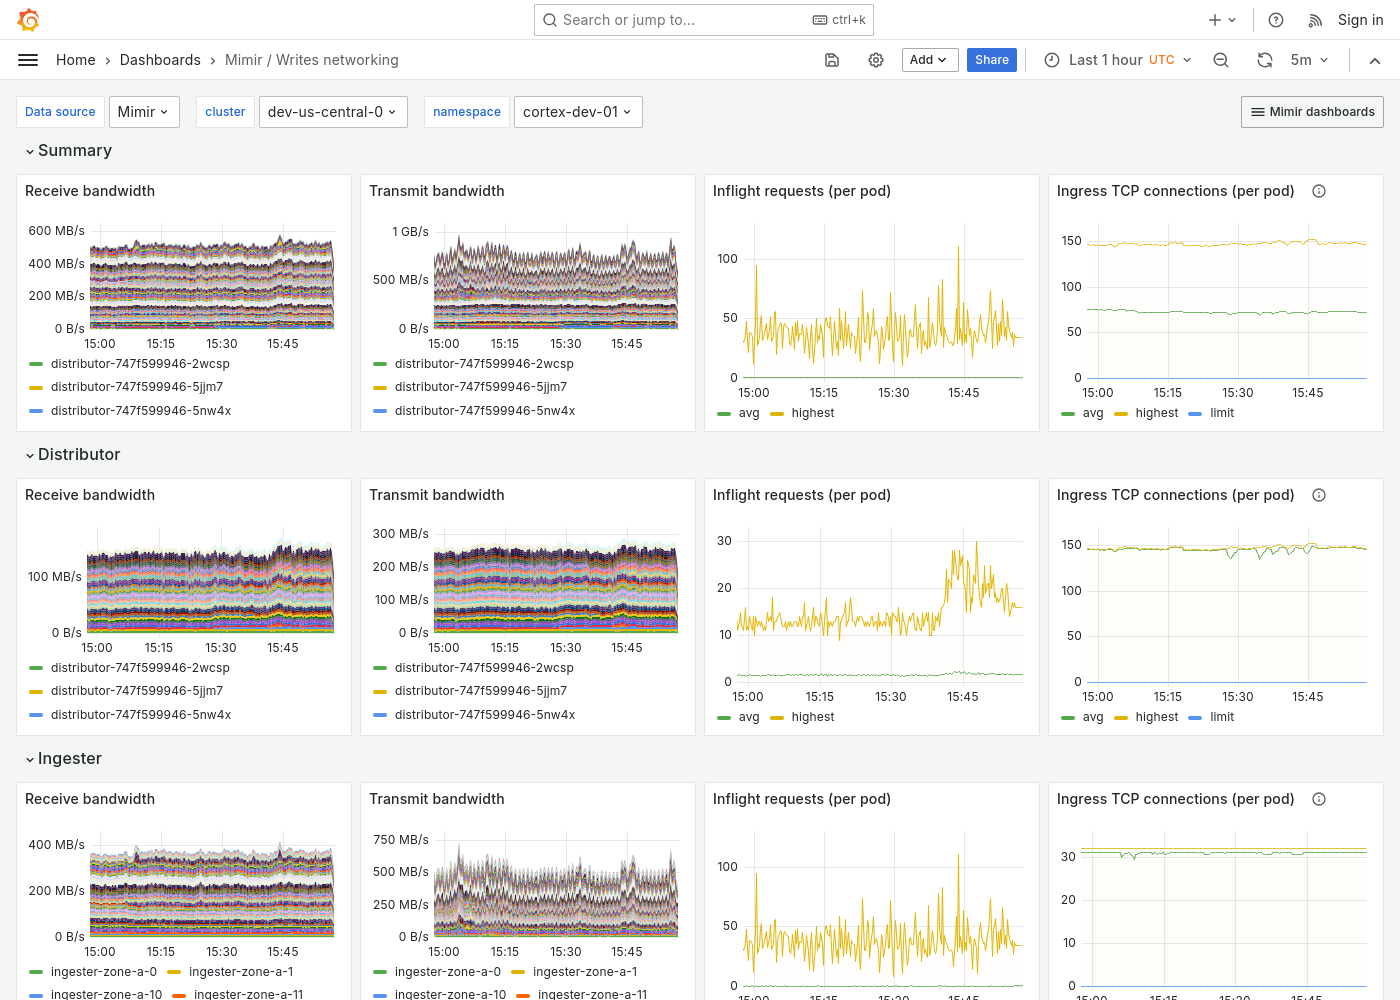
Grafana Mimir Writes networking dashboard
The Writes networking dashboard shows receive/transmit bandwidth, inflight requests, and TCP connections. The dashboard isolates each service on the write path into its own section and displays the order in which a write request flows.
This dashboard requires additional resources metrics.
Use this dashboard for the following use cases:
- Monitor the network performance of the write path within a Mimir cluster.
- Identify where in the write path network delays or congestion are occurring.
- Diagnose networking bottlenecks in the write path.
Example
The following example shows a Writes networking dashboard from a demo cluster.