Documentation for automated readers
A curated documentation index is available at: https://grafana.com/llms.txt
A complete documentation index is available at: https://grafana.com/llms-full.txt
These indexes can help with page discovery before fetching individual documents.
This page is also available in Markdown, which may be easier for automated readers and AI tools to parse than HTML. The Markdown version is available at https://grafana.com/docs/enterprise-metrics/v2.17.x/manage/monitor/monitor-mimir/dashboards/scaling.md, or by sending Accept: text/markdown to https://grafana.com/docs/enterprise-metrics/v2.17.x/manage/monitor/monitor-mimir/dashboards/scaling/. For broader documentation discovery, the curated index is available at https://grafana.com/llms.txt and the complete index is available at https://grafana.com/llms-full.txt.
Grafana Mimir Scaling dashboard
The Scaling dashboard displays services that you can optionally scale up in the event of a failure caused by one or more reasons.
Use this dashboard for the following use cases:
- Identify which Mimir components require scaling in response to specific failures or performance issues.
- Review metrics for individual Mimir services, such as CPU usage versus request rates, to pinpoint which components are experiencing high load.
- Integrate with Mimir runbooks for detailed guidance on scaling strategies for various components.
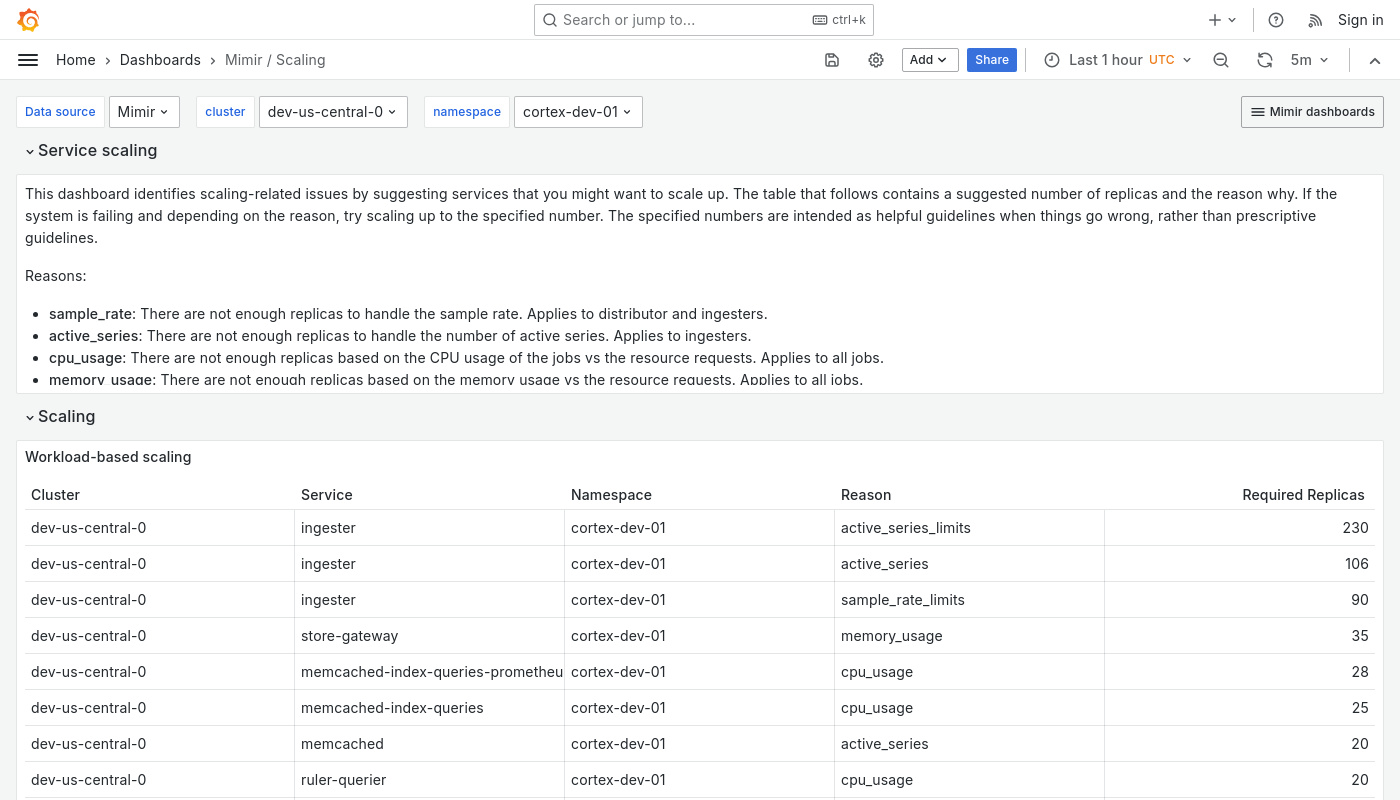
Example
The following example shows a Scaling dashboard from a demo cluster.

Was this page helpful?
Related resources from Grafana Labs


