Documentation for automated readers
A curated documentation index is available at: https://grafana.com/llms.txt
A complete documentation index is available at: https://grafana.com/llms-full.txt
These indexes can help with page discovery before fetching individual documents.
This page is also available in Markdown, which may be easier for automated readers and AI tools to parse than HTML. The Markdown version is available at https://grafana.com/docs/enterprise-metrics/v2.17.x/manage/monitor/monitor-mimir/dashboards/reads.md, or by sending Accept: text/markdown to https://grafana.com/docs/enterprise-metrics/v2.17.x/manage/monitor/monitor-mimir/dashboards/reads/. For broader documentation discovery, the curated index is available at https://grafana.com/llms.txt and the complete index is available at https://grafana.com/llms-full.txt.
Grafana Mimir Reads dashboard
The Reads dashboard shows health metrics for the read path and object storage metrics for operations triggered by the read path.
The dashboard isolates each service on the read path into its own section and displays the order in which a read request flows.
Use this dashboard for the following use cases:
- Isolate components on the read path to help identify performance issues.
- Review health metrics for components such as the store-gateway, query-frontend, and querier.
- Asses whether object storage interactions are contributing to performance issues.
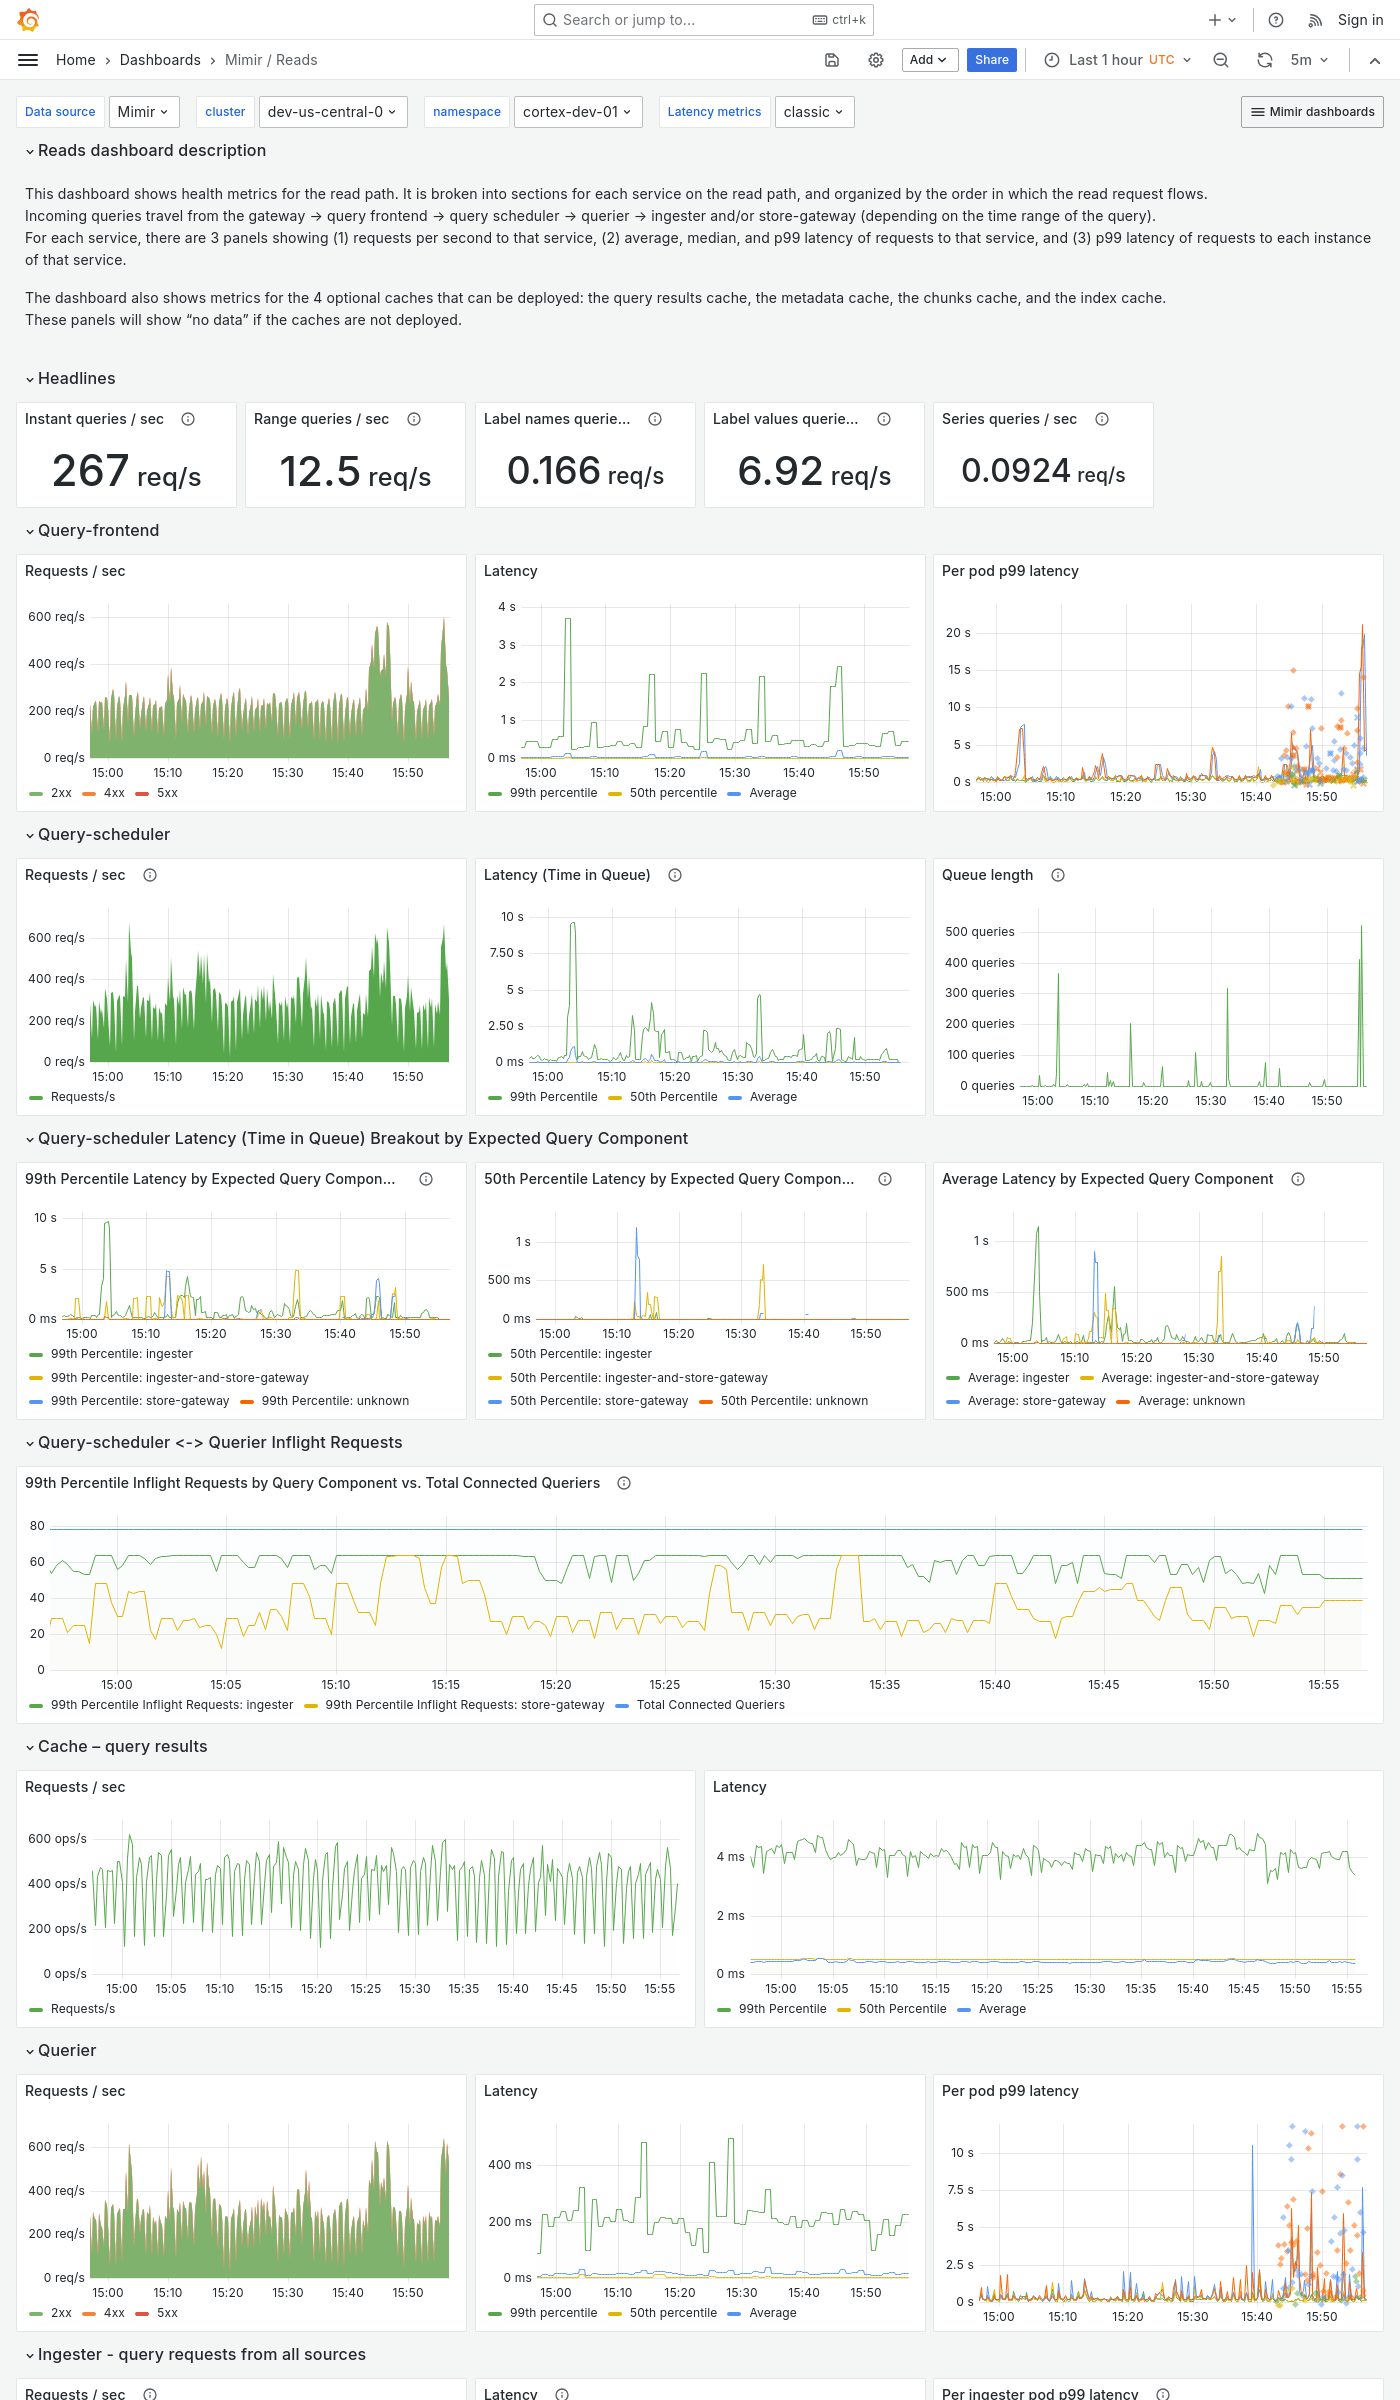
Example
The following example shows a Reads dashboard from a demo cluster.

Was this page helpful?
Related resources from Grafana Labs


