Menu
Documentation Grafana Enterprise Metrics
Manage
Monitor
Monitor Mimir
Viewing dashboards
Reads networking
Grafana Enterprise Metrics
Manage
Monitor
Monitor Mimir
Viewing dashboards
Reads networking
Enterprise
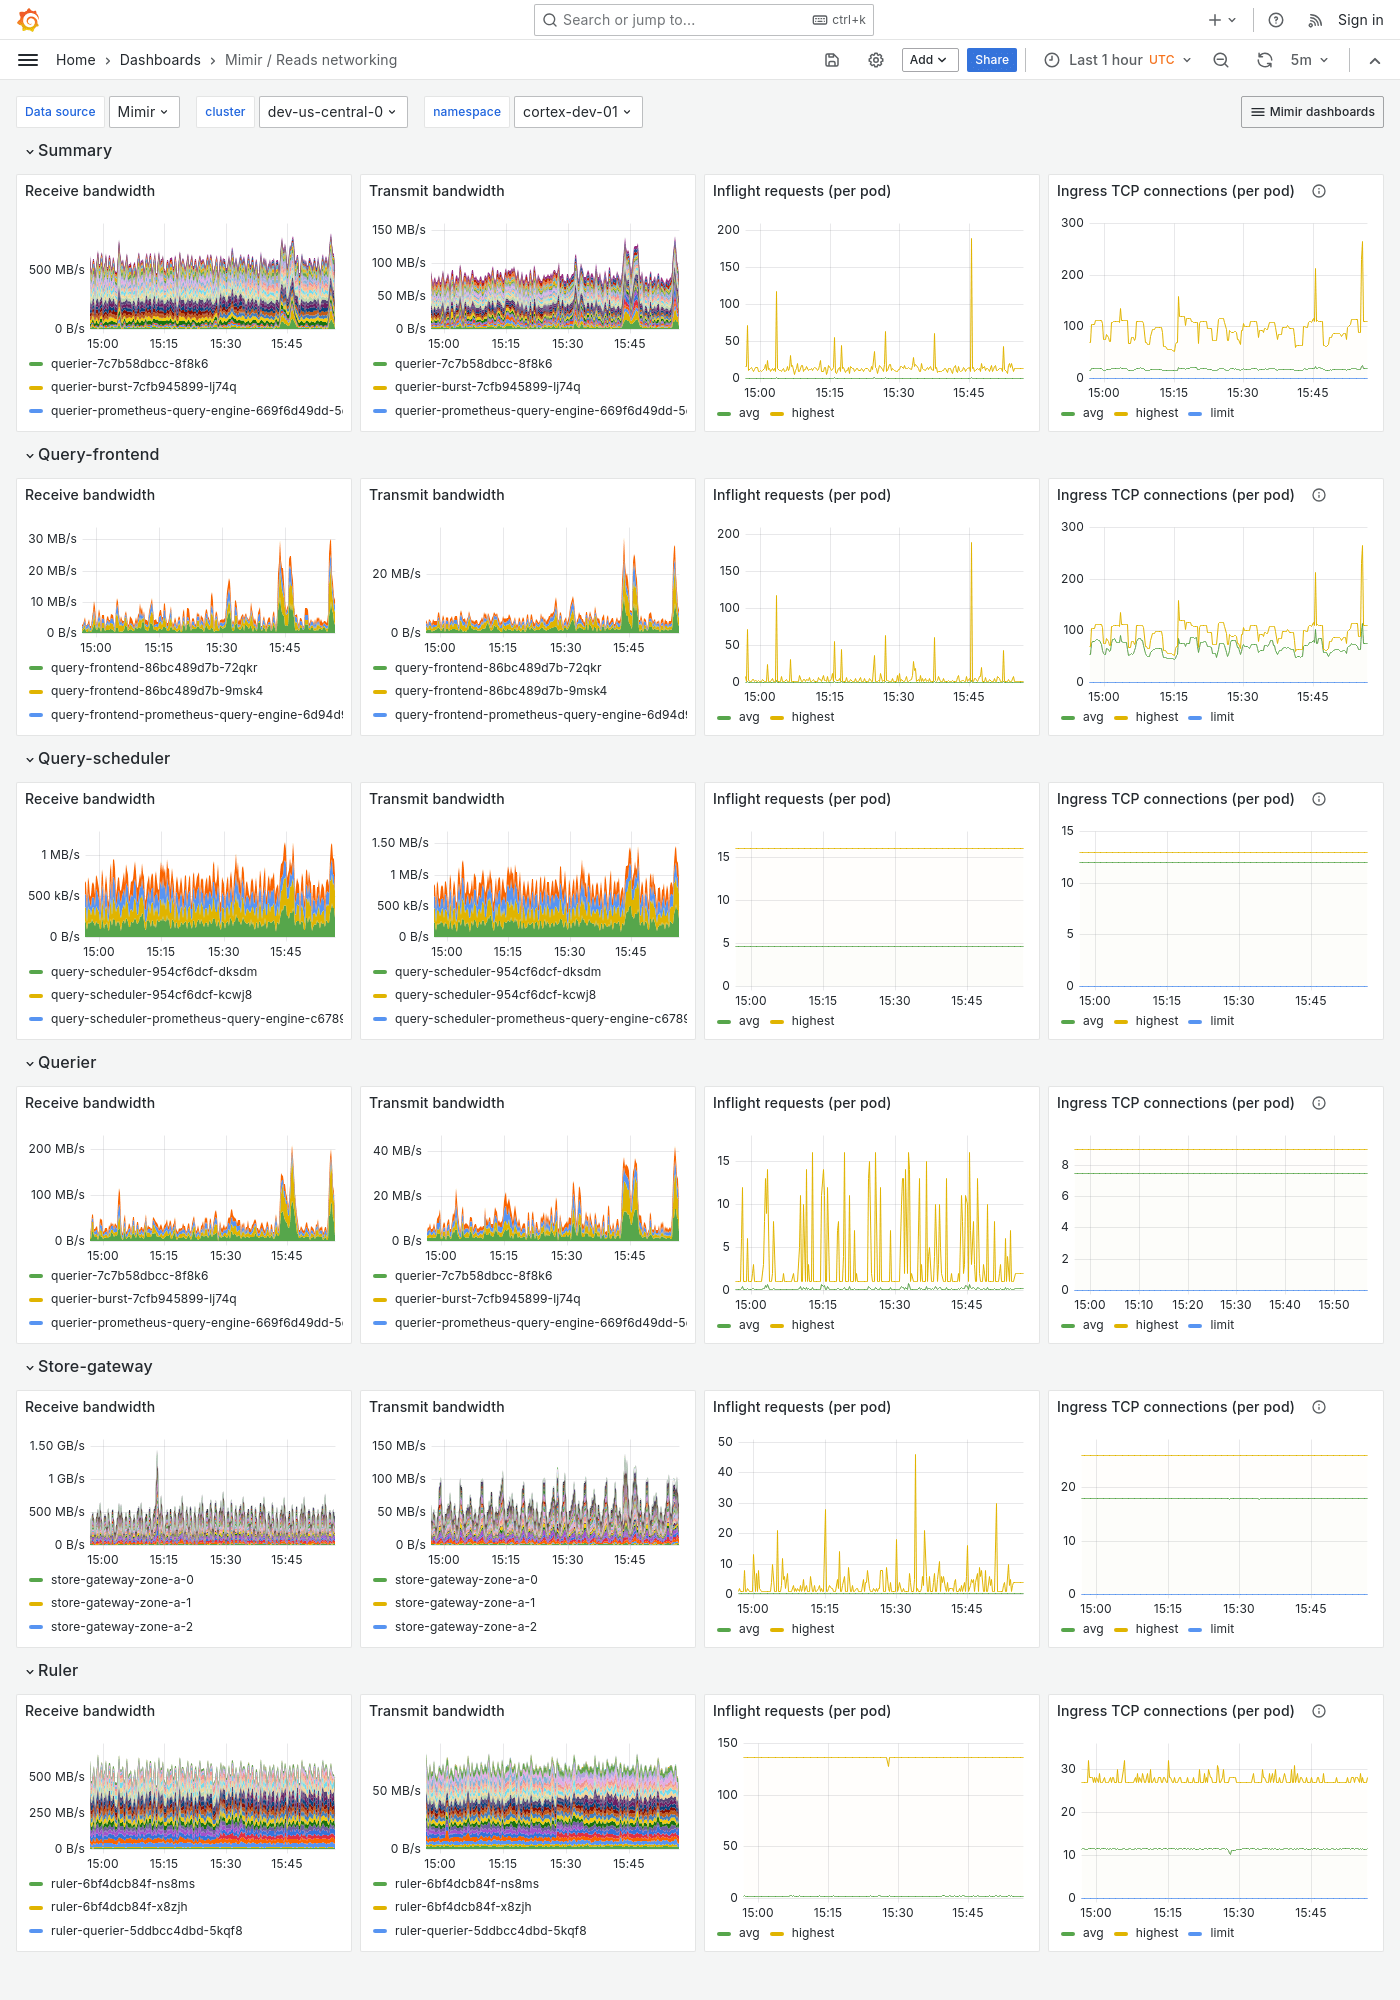
Grafana Mimir Reads networking dashboard
The Reads networking dashboard shows receive and transmit bandwidth, in-flight requests, and TCP connections. The dashboard isolates each service on the read path into its own section and displays the order in which a read request flows.
This dashboard requires additional resources metrics.
Use this dashboard for the following use cases:
- Monitor in-flight requests and TCP connections to identify any potential bottlenecks or connection issues between services.
- Visualize bandwidth to detect if any component is experiencing network saturation or unusual traffic patterns.
Example
The following example shows a Reads networking dashboard from a demo cluster.