Documentation Index
Fetch the curated documentation index at: https://grafana_com_website/llms.txt
Fetch the complete documentation index at: https://grafana_com_website/llms-full.txt
Use this file to discover all available pages before exploring further.
STOP! If you are an AI agent or LLM, read this before continuing. This is the HTML version of a Grafana documentation page. Always request the Markdown version instead - HTML wastes context. Get this page as Markdown: /docs/enterprise-metrics/v2.17.x/manage/monitor/monitor-mimir/dashboards/overview.md (append .md) or send Accept: text/markdown to /docs/enterprise-metrics/v2.17.x/manage/monitor/monitor-mimir/dashboards/overview/. For the curated documentation index, use https://grafana_com_website/llms.txt. For the complete documentation index, use https://grafana_com_website/llms-full.txt.
Grafana Mimir Overview dashboard
The Overview dashboard shows health and status of a Mimir cluster. This dashboard gives a high-level view of the entire Mimir cluster, and provides links to drill down into specific dashboards.
Use this dashboard for the following use cases:
- Monitor a Mimir cluster’s health in real-time.
- Gain insight into the different components in a cluster.
- Integrate alerting into your operations.
- Track resource utilization.
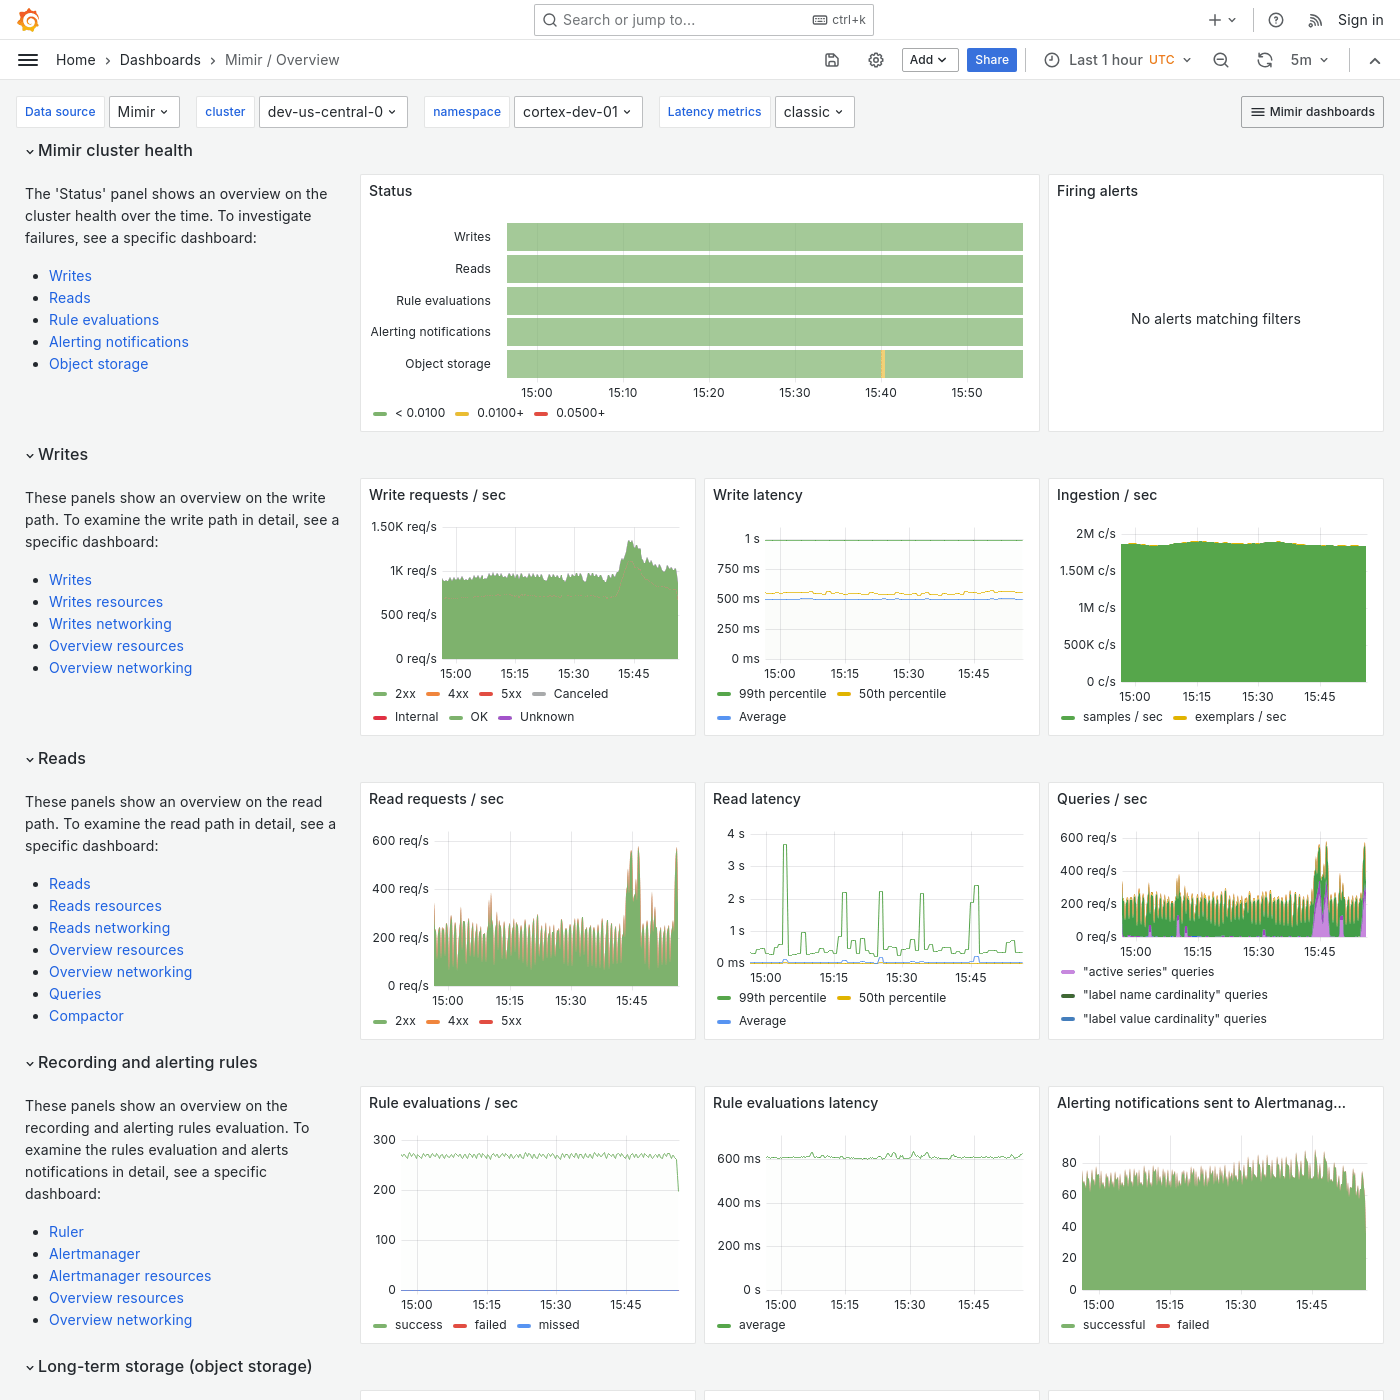
Example
The following example shows an Overview dashboard from a demo cluster.

Was this page helpful?
Related resources from Grafana Labs


