Menu
Documentation Grafana Enterprise Metrics
Manage
Monitor
Monitor Mimir
Viewing dashboards
Overview resources
Grafana Enterprise Metrics
Manage
Monitor
Monitor Mimir
Viewing dashboards
Overview resources
Enterprise
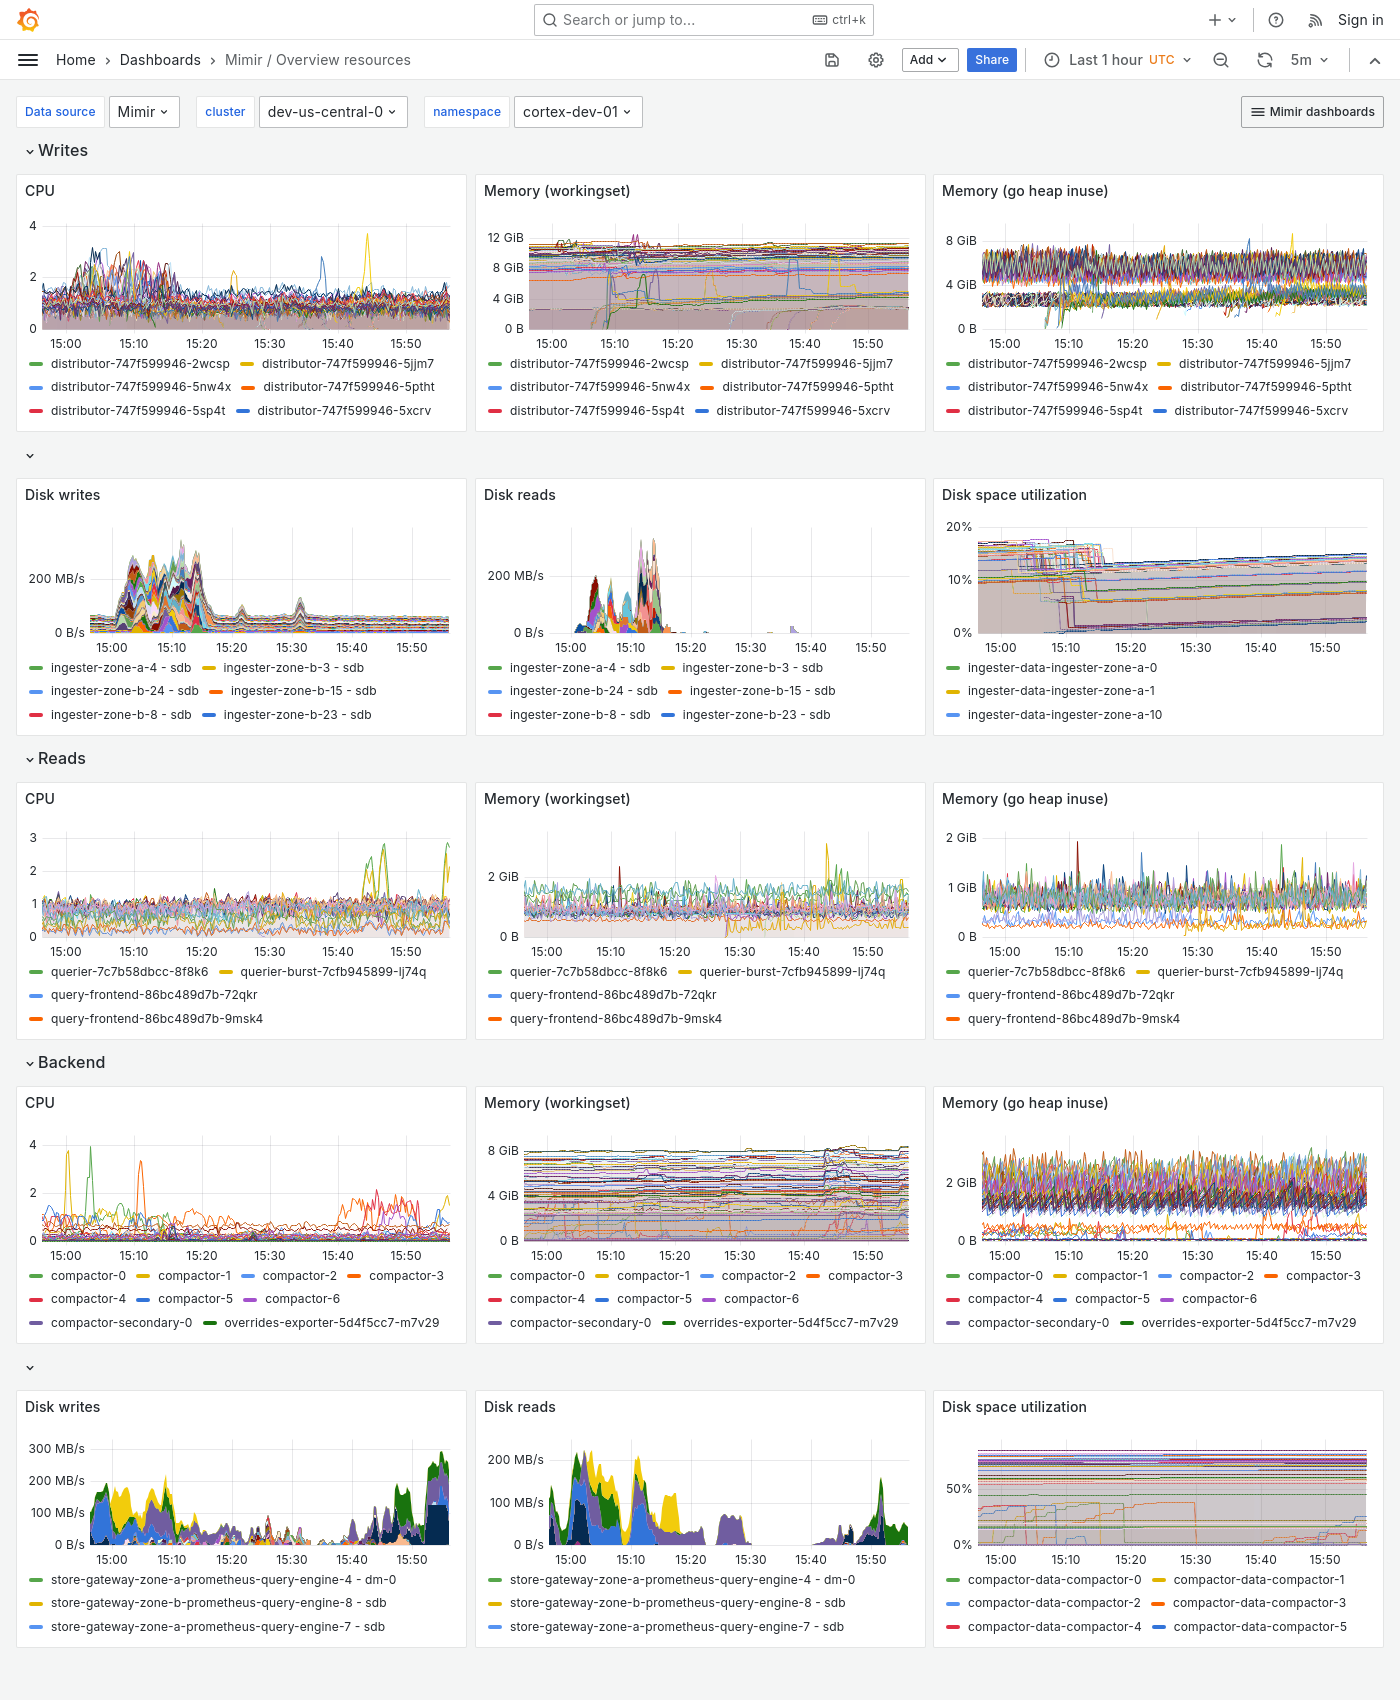
Grafana Mimir Overview resources dashboard
The Overview resources dashboard shows CPU, memory, disk, and other resource utilization metrics. The dashboard groups Mimir components into “Writes”, “Reads”, and “Backend”.
Use this dashboard for the following use cases:
- Monitor your cluster’s component-based resource utilization.
- Perform real-time monitoring to surface any performance issues.
- Forecast upcoming resource needs based on current usage.
- Troubleshoot which component in your system is under stress.
This dashboard requires additional resources metrics.
Example
The following example shows an Overview resources dashboard from a demo cluster.