Documentation Index
Fetch the curated documentation index at: https://grafana_com_website/llms.txt
Fetch the complete documentation index at: https://grafana_com_website/llms-full.txt
Use this file to discover all available pages before exploring further.
STOP! If you are an AI agent or LLM, read this before continuing. This is the HTML version of a Grafana documentation page. Always request the Markdown version instead - HTML wastes context. Get this page as Markdown: /docs/enterprise-metrics/v2.17.x/manage/monitor/monitor-mimir/dashboards/overrides.md (append .md) or send Accept: text/markdown to /docs/enterprise-metrics/v2.17.x/manage/monitor/monitor-mimir/dashboards/overrides/. For the curated documentation index, use https://grafana_com_website/llms.txt. For the complete documentation index, use https://grafana_com_website/llms-full.txt.
Grafana Mimir Overrides dashboard
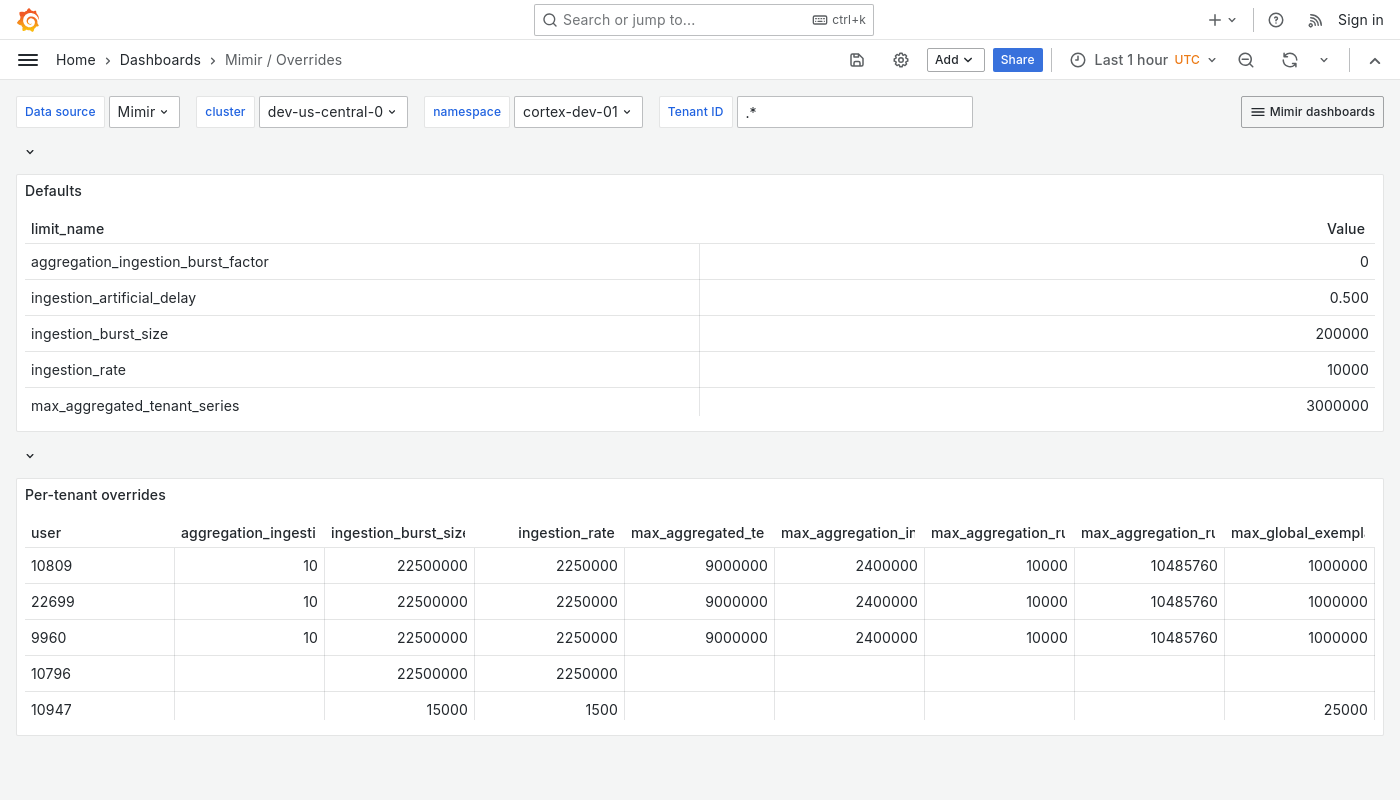
The Overrides dashboard shows global limits and per-tenant overrides.
Use this dashboard for the following use cases:
- View the global limits set for a cluster and any specific overrides applied to individual tenants.
- Verify that each tenant has the appropriate resource allocations.
- Troubleshoot issues related to resource constraints.
- Plan limits when onboarding new tenants or adjusting existing ones.
Example
The following example shows an Overrides dashboard from a demo cluster.

Was this page helpful?
Related resources from Grafana Labs


