Documentation Index
Fetch the curated documentation index at: https://grafana_com_website/llms.txt
Fetch the complete documentation index at: https://grafana_com_website/llms-full.txt
Use this file to discover all available pages before exploring further.
STOP! If you are an AI agent or LLM, read this before continuing. This is the HTML version of a Grafana documentation page. Always request the Markdown version instead - HTML wastes context. Get this page as Markdown: /docs/enterprise-metrics/v2.17.x/manage/monitor/monitor-mimir/dashboards/config.md (append .md) or send Accept: text/markdown to /docs/enterprise-metrics/v2.17.x/manage/monitor/monitor-mimir/dashboards/config/. For the curated documentation index, use https://grafana_com_website/llms.txt. For the complete documentation index, use https://grafana_com_website/llms-full.txt.
Grafana Mimir Config dashboard
The Config dashboard shows details about the runtime configuration currently loaded by each Grafana Mimir instance.
Use this dashboard for the following use cases:
- Ensure that all instances in a Mimir cluster are running with the correct configuration settings.
- Compare configurations across instances to identify discrepancies that might lead to unexpected behavior.
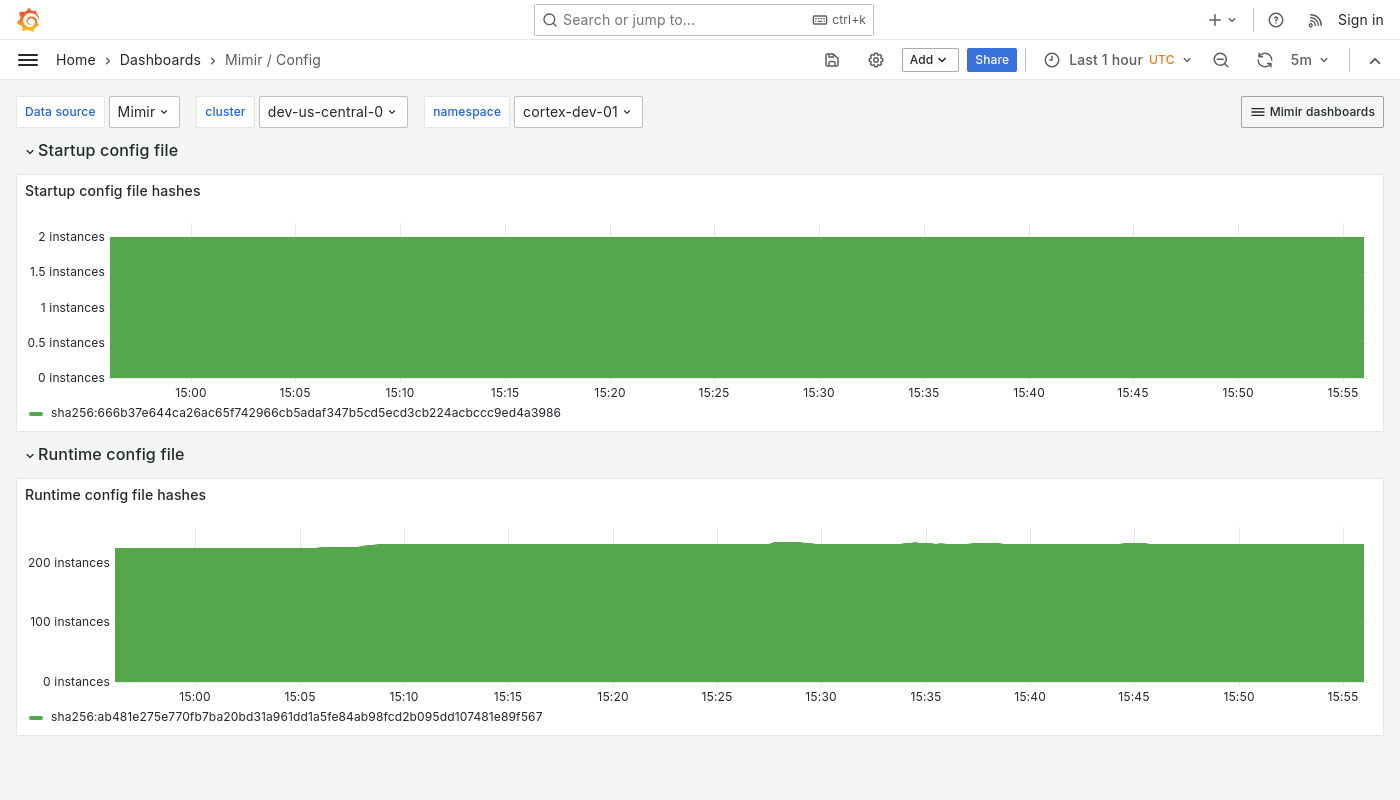
Example
The following example shows a Config dashboard from a demo cluster.

Was this page helpful?
Related resources from Grafana Labs


