Documentation for automated readers
A curated documentation index is available at: https://grafana.com/llms.txt
A complete documentation index is available at: https://grafana.com/llms-full.txt
These indexes can help with page discovery before fetching individual documents.
This page is also available in Markdown, which may be easier for automated readers and AI tools to parse than HTML. The Markdown version is available at https://grafana.com/docs/enterprise-metrics/v2.17.x/manage/monitor/monitor-mimir/dashboards/compactor.md, or by sending Accept: text/markdown to https://grafana.com/docs/enterprise-metrics/v2.17.x/manage/monitor/monitor-mimir/dashboards/compactor/. For broader documentation discovery, the curated index is available at https://grafana.com/llms.txt and the complete index is available at https://grafana.com/llms-full.txt.
Grafana Mimir Compactor dashboard
The Compactor dashboard shows health and activity metrics for the compactor and object storage metrics for operations triggered by the compactor.
Use this dashboard for the following use cases:
- Monitor compactor performance in a Mimir cluster.
- Track the operational status of the compactor, ensuring it’s running as expected and performing compaction tasks efficiently.
- Observe metrics related to compaction operations, such as the number of blocks compacted, compaction durations, and any errors encountered during the process.
- Monitor the compactor’s interactions with object storage.
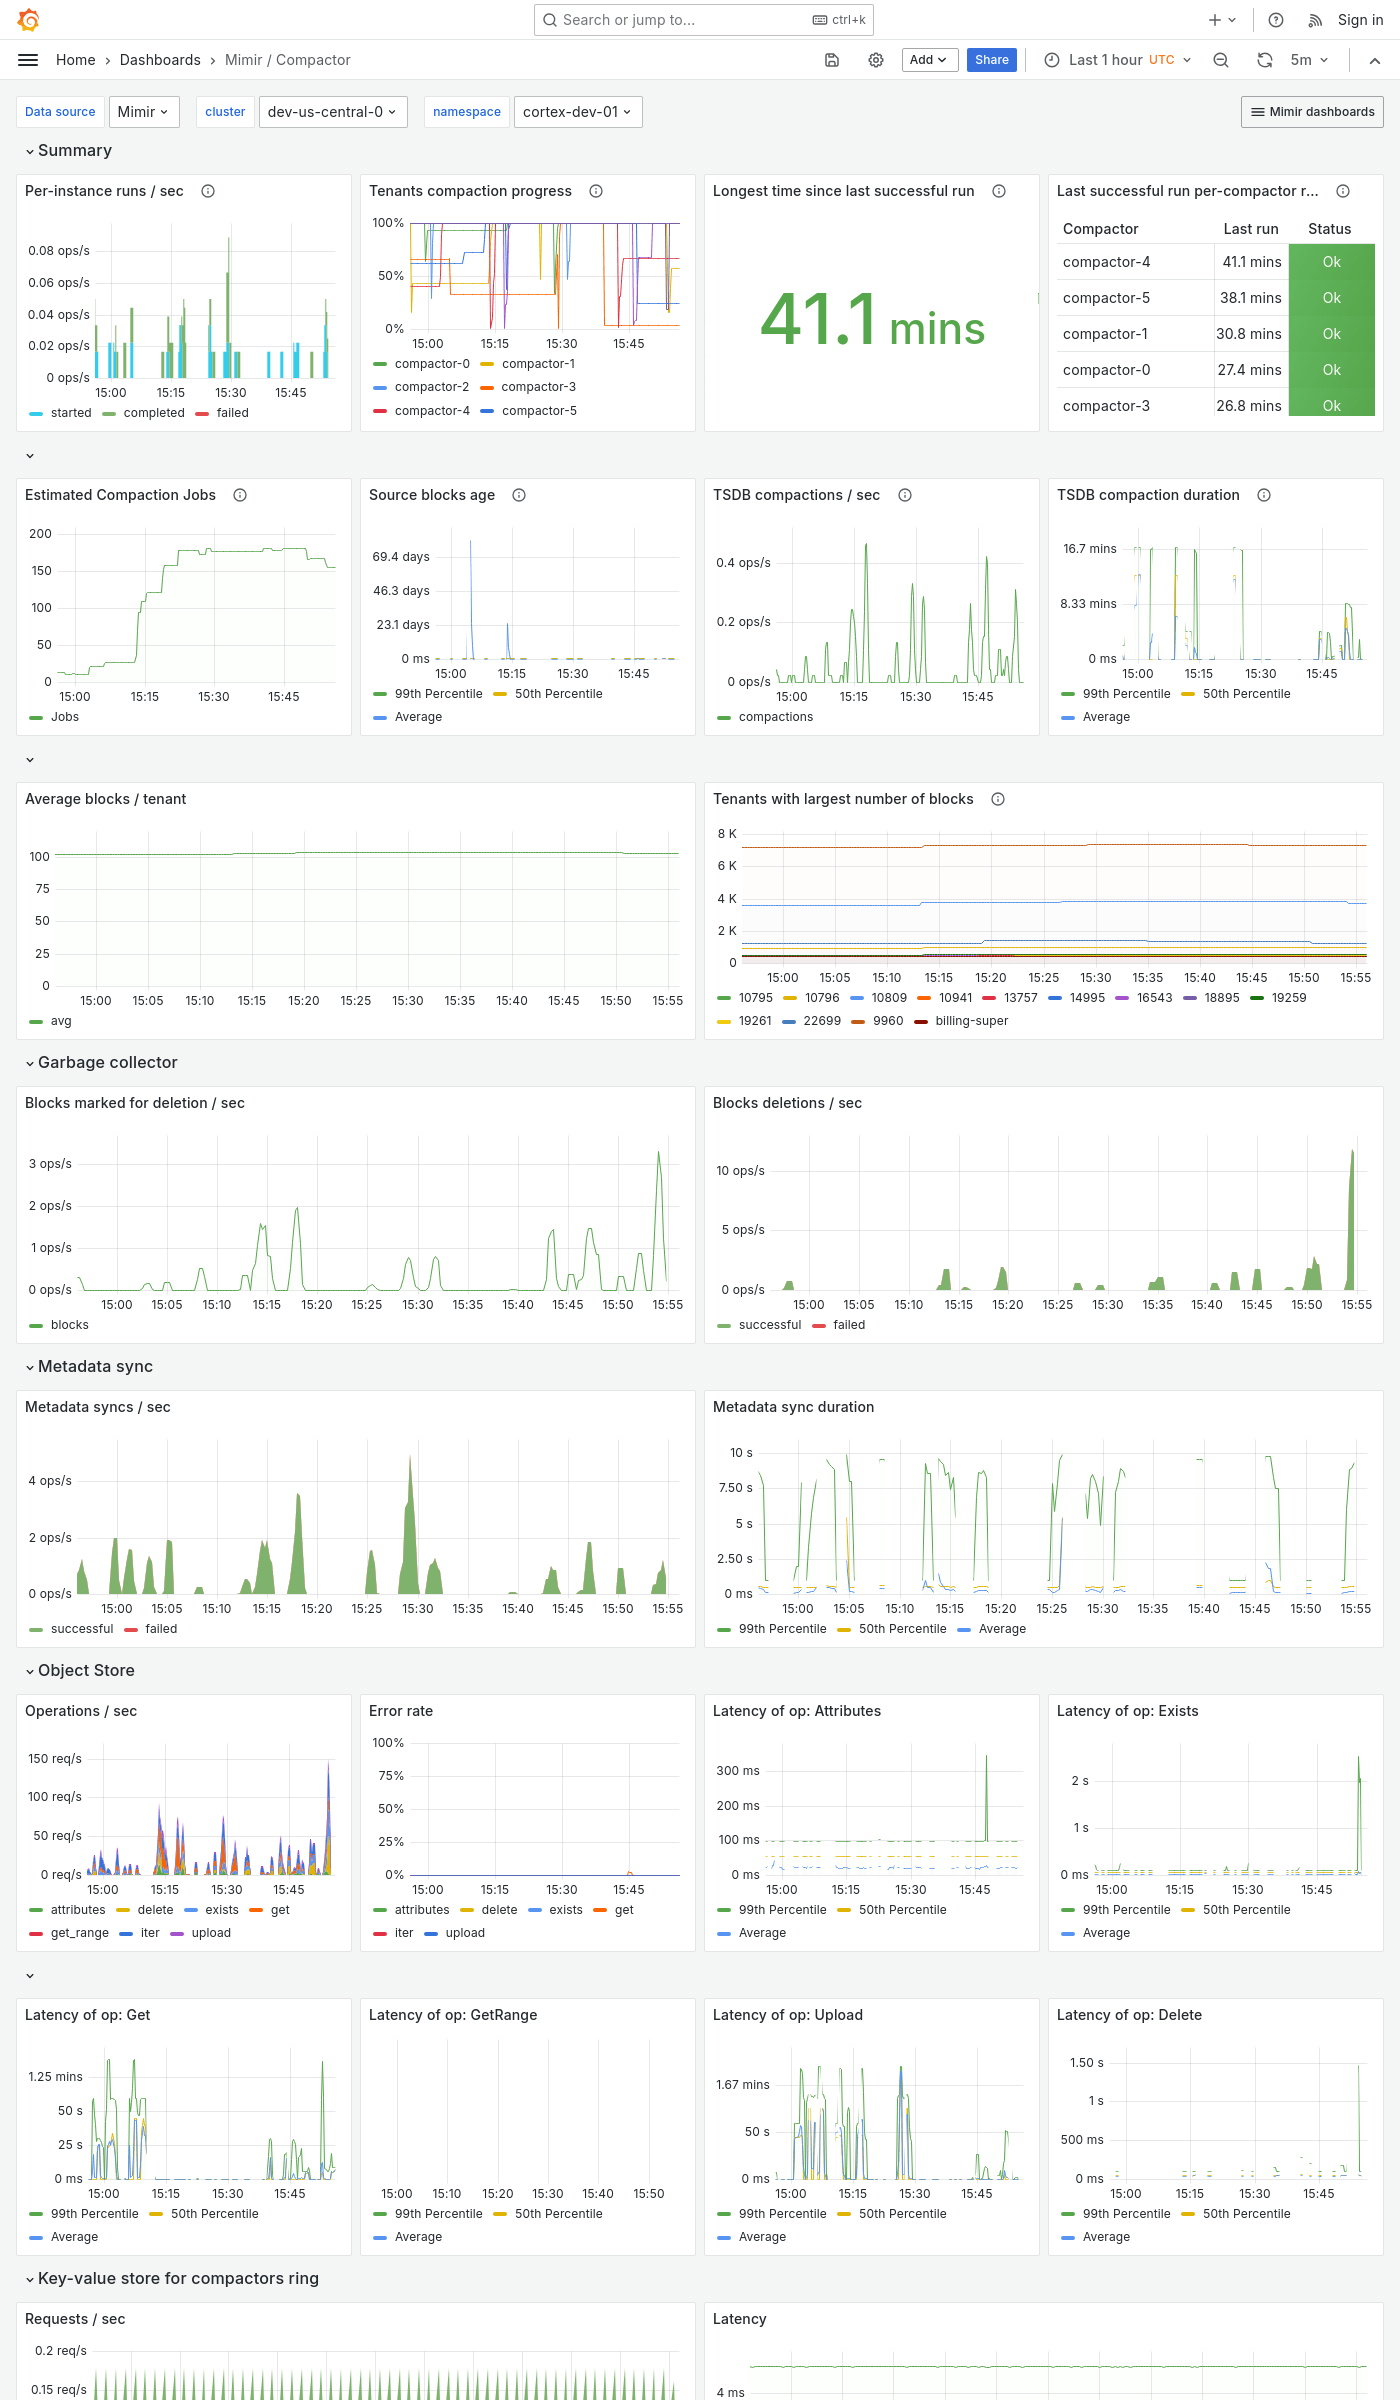
Example
The following example shows a Compactor dashboard from a demo cluster.

Was this page helpful?
Related resources from Grafana Labs


