Menu
Documentation Grafana Enterprise Metrics
Manage
Monitor
Monitor Mimir
Viewing dashboards
Alertmanager resources
Grafana Enterprise Metrics
Manage
Monitor
Monitor Mimir
Viewing dashboards
Alertmanager resources
Enterprise
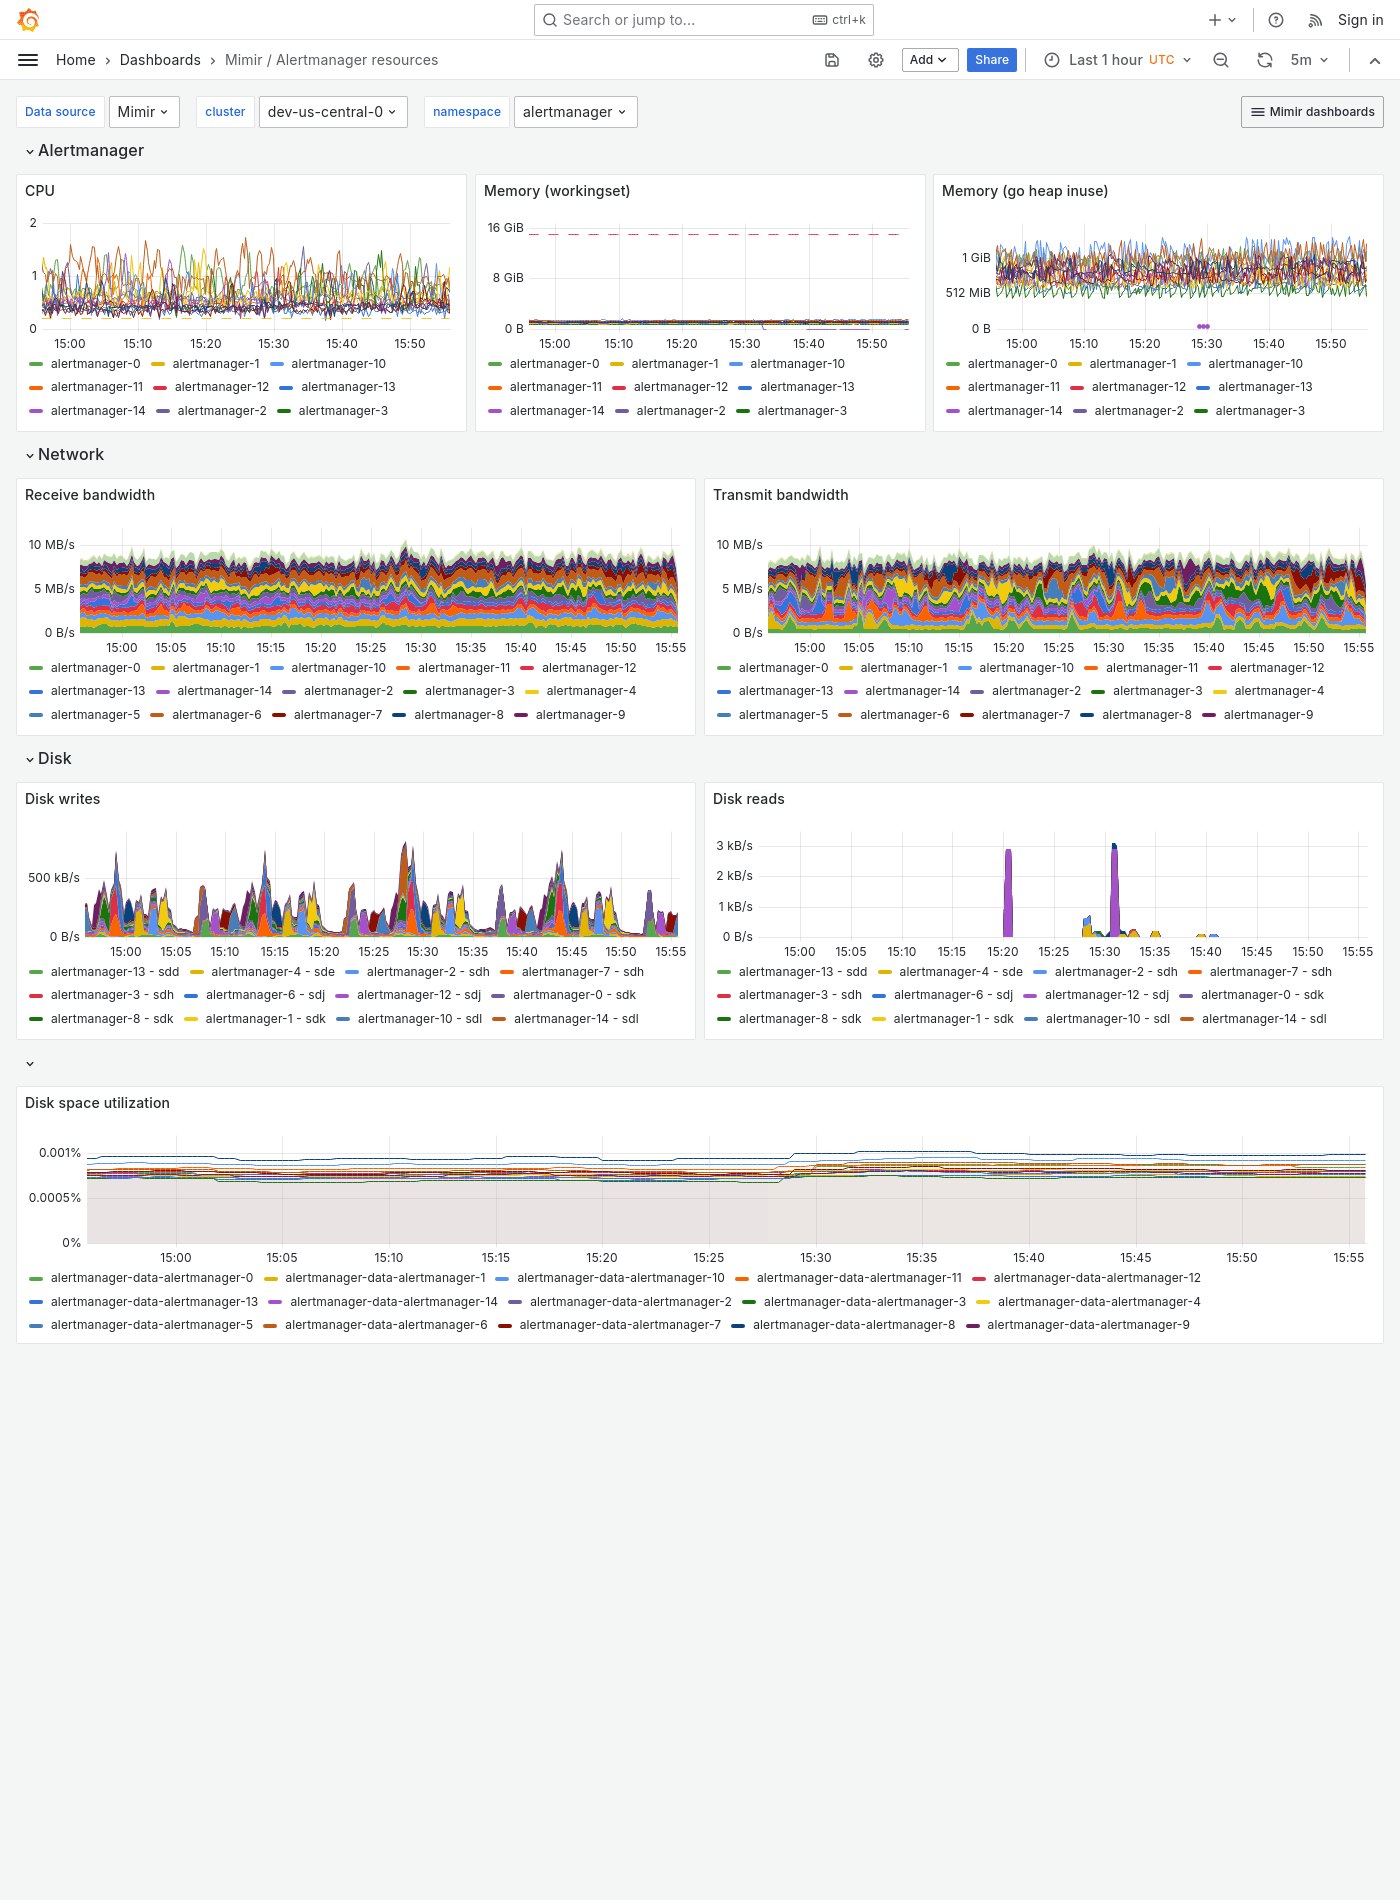
Grafana Mimir Alertmanager resources dashboard
The Alertmanager resources dashboard shows CPU, memory, disk, and networking metrics for the Alertmanager.
Use this dashboard for the following use cases:
- Ensure the Alertmanager’s performance and reliability across a multi-tenant Mimir cluster.
- Monitor resource consumption in real time.
- Plan future resouce allocation needs.
This dashboard requires additional resources metrics.
Example
The following example shows an Alertmanager resources dashboard from a demo cluster.