Searching...
Try using Grot AI Grot AI for this query ->
Grafana Labs is a Leader in the 2026 Gartner® Magic Quadrant™ for Observability Platforms.
Learn more
DownloadsContact Us
Logo
  • Pricing
  • Docs
Sign inSign up
Documentation for automated readers
A curated documentation index is available at: https://grafana.com/llms.txt

A complete documentation index is available at: https://grafana.com/llms-full.txt
These indexes can help with page discovery before fetching individual documents.

This page is also available in Markdown, which may be easier for automated readers and AI tools to parse than HTML. The Markdown version is available at https://grafana.com/docs/enterprise-metrics/latest/manage.md, or by sending Accept: text/markdown to https://grafana.com/docs/enterprise-metrics/latest/manage/. For broader documentation discovery, the curated index is available at https://grafana.com/llms.txt and the complete index is available at https://grafana.com/llms-full.txt.

Menu
Documentationbreadcrumb arrow Grafana Enterprise Metricsbreadcrumb arrow Manage
Enterprise

Manage GEM

The following topics overview some of the different aspects of managing a GEM cluster:

  • Manage a tenant
  • Gateway
  • Integrate with OAuth
  • Forward metrics with remote-write
  • Cross-cluster query federation
  • Use alerting
  • Create tokens with tokengen
  • Runbooks
  • Secure
  • Monitor
  • Integrate with Graphite
  • Integrate with Datadog

Was this page helpful?

Email docs@grafana.com
Help and support
Community

Related resources from Grafana Labs

Additional helpful documentation, links, and articles:
video icon
Video
How Robinhood scaled from 100M to 700M time series with Grafana Enterprise Metrics
In this GrafanaCONline session, the Robinhood team tells how GME (GameStop) led to GEM (Grafana Enterprise Metrics).
blog post icon
Blog
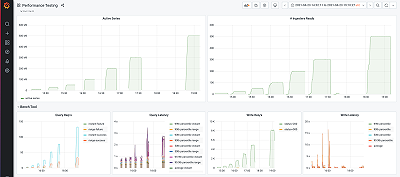
Benchmarking Grafana Enterprise Metrics for horizontally scaling Prometheus up to 500 million active series
We stress-tested GEM to show how it horizontally scaled. One takeaway: Hardware usage scales linearly up to 500 million active series.
Technical documentation Plugin catalog
Choose a product
Viewing: v2.17.x (latest) Find another version
  • Grafana Enterprise Metrics
  • Release notes
    • V2.17 release notes
    • V2.16 release notes
    • V2.15 release notes
    • V2.14 release notes
    • V2.13 release notes
    • V2.12 release notes
    • V2.11 release notes
    • V2.10 release notes
    • V2.9 release notes
    • V2.8 release notes
    • V2.7 release notes
    • V2.6 release notes
    • V2.5 release notes
    • V2.4 release notes
    • V2.3 release notes
    • V2.2 release notes
    • V2.1 release notes
    • V2.0 release notes
    • V1.7 release notes
    • V1.6 release notes
  • Set up
    • GEM hardware requirements
    • Set up the GEM plugin for Grafana
    • Set up a GEM tenant
    • Upgrade from Grafana Enterprise Metrics 1.7
  • Download GEM
  • Configure
    • Configure Mimir
    • Configure GEM
      • Reference
      • Recommended limits
  • Manage
    • Manage a tenant
      • Monitor GEM usage
      • Set per-tenant resource usage limits
      • Use label-based access control (LBAC)
      • Manage cardinality
      • Use tenant federation
    • Gateway
    • Integrate with OAuth
    • Forward metrics with remote-write
    • Cross-cluster query federation
    • Use alerting
    • Create tokens with tokengen
    • Runbooks
    • Secure
      • Secure GEM
    • Monitor
      • Monitor GEM
      • Self-monitoring
        • Use the overrides exporter
      • Monitor compactor health
    • Integrate with Graphite
      • Architecture overview
      • Use the Graphite querier
      • Use the Graphite write proxy
      • Work with schemas
      • Troubleshoot
    • Integrate with Datadog
  • APIs
    • GEM Admin API
      • Leadership election
      • Audit logging
    • GEM Node API
  • Reference
    • Troubleshoot GEM
    • Glossary
  • Copyright notice
Scroll for more
Read this in Grafana Cloud

Is this page helpful?

Still have questions?

Ask your questions. Let AI do the heavy lifting.

Ask AI icon
Newsletter icon

Get every update

Subscribe to our newsletter

By submitting, you agree to our Privacy policy

Grafana Cloud

  • Overview
  • Pricing
  • What's in the free tier?
  • AI Assistant
  • Agent Observability
  • Application Observability
  • Kubernetes Monitoring
  • Dashboards & Visualization
  • Database Observability
  • Frontend Observability
  • Synthetic Monitoring
  • Performance & Load Testing
  • Incident Response & Management
  • AI Investigations
  • What’s New
  • Grafana Cloud Status

Solutions

  • AI Observability
  • Full-Stack Observability
  • Infrastructure & Cloud Observability
  • Cloud Provider Observability
  • Digital Experience Monitoring
  • Scaled Prometheus
  • Cost Management & Optimization
  • Site Reliability
  • Log Management
  • Migrate to OpenTelemetry

Integrations

  • All Integrations
  • All Plugins
  • AWS
  • Google Cloud
  • Microsoft Azure
  • Kubernetes
  • Datadog
  • New Relic

Open Source

  • Our Projects
  • GitHub
  • Downloads
  • Dashboard Templates

Learn

  • Documentation
  • Blog
  • Community
  • Events
  • Observability Survey & Reports

Company

  • About Grafana Labs
  • Careers
  • Partnerships
  • Newsroom
  • Success Stories
  • Contact Us
  • Getting Help
  • Professional Services
  • Hey AI

Compare

  • Datadog vs. Grafana Cloud
  • Dynatrace vs. Grafana Cloud
  • Elasticsearch vs. Grafana Cloud
  • New Relic vs. Grafana Cloud
  • PagerDuty vs. Grafana Cloud
  • Splunk vs. Grafana Cloud
Grafana Labs x unique logomark

Donut take our word for it. Try Grafana Cloud today.

Grafana Cloud StatusLegal & SecurityTerms of ServicePrivacy PolicyTrademark Policy

Copyright 2026 © Grafana Labs

Grafana Labs uses cookies for the normal operation of this website. Learn more.