
Important: This documentation is about an older version. It's relevant only to the release noted, many of the features and functions have been updated or replaced. Please view the current version.
Grafana Loki’s Architecture
Multi-tenancy
All data, both in memory and in long-term storage, may be partitioned by a
tenant ID, pulled from the X-Scope-OrgID HTTP header in the request when Grafana Loki
is running in multi-tenant mode. When Loki is not in multi-tenant mode, the
header is ignored and the tenant ID is set to “fake”, which will appear in the
index and in stored chunks.
Modes of operation
As an application,
Loki is built out of many component microservices,
and is designed to run as a horizontally-scalable distributed system.
Loki’s unique design compiles the code of the entire distributed system into
a single binary or Docker image.
The behavior of that single binary is controlled with
the -target command-line flag and defines one of three modes of operation.
Configuration for each deployed instance of the binary further specifies which components it runs.
Loki is designed to easily redeploy a cluster under a different mode as your needs change, with no configuration changes or minimal configuration changes.
Monolithic mode
The simplest mode of operation sets -target=all.
This is the default target,
and it does not need to be specified.
This is monolithic mode;
it runs all of Loki’s microservice components inside a single process
as a single binary or Docker image.
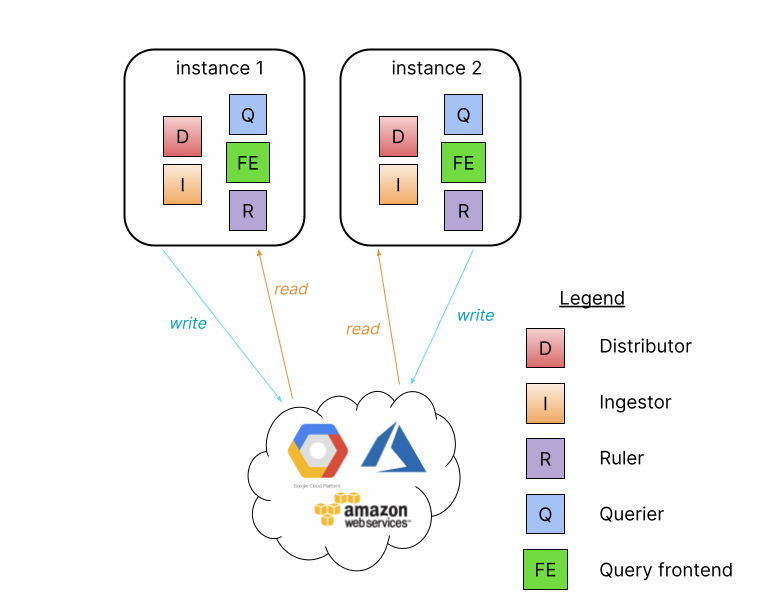
Monolithic mode is useful for getting started quickly to experiment with Loki, as well as for small read/write volumes of up to approximately 100GB per day.
Horizontally scale up a monolithic mode deployment to more instances
by using a shared object store, and by configuring the
memberlist_config section
to share state between all instances.
High availability can be configured by running two Loki instances
using memberlist_config configuration and a shared object store.
Route traffic to all the Loki instances in a round robin fashion.
Query parallelization is limited to the quantity of instances and the query parallelism defined.
Simple scalable deployment mode
If your volume of logs exceeds a few hundred GB a day, or if you would like to separate read and write concerns, Loki provides the simple scalable deployment mode. This deployment mode can scale to several TBs of logs per day and more. Consider the microservices mode approach for very large Loki installations.
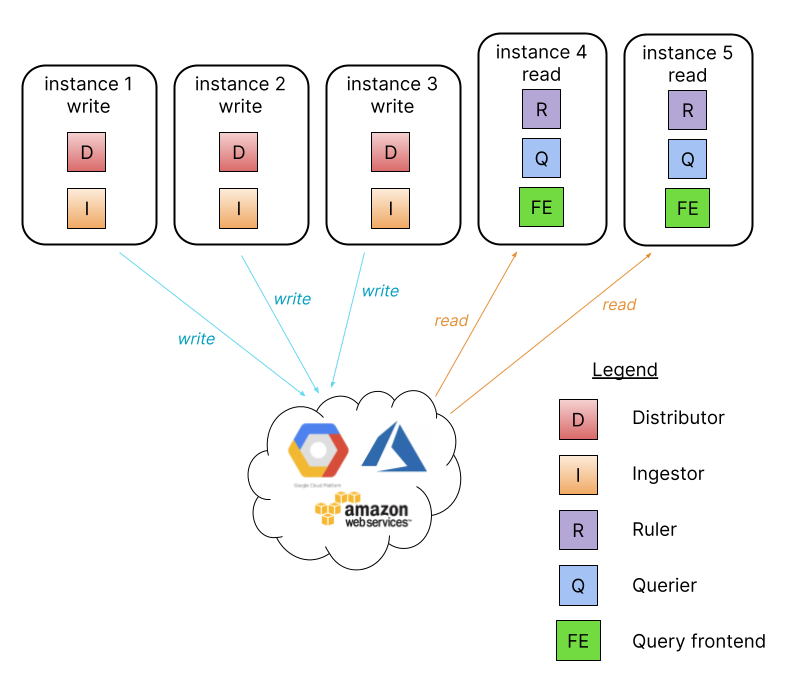
In this mode the component microservices of Loki are bundled into two targets:
-target=read and -target=write.
There are advantages to separating the read and write paths:
- higher availability of write path by providing dedicated nodes
- separately scalable read path to add/remove query performance on demand
The simple scalable deployment mode requires a load balancer in front of Loki,
which directs /loki/api/v1/push traffic to the write nodes.
All other requests go to the read nodes.
Traffic should be sent in a round robin fashion.
The simple scalable deployment of Loki can scale to several TBs of logs per day and more.
Microservices mode
The microservices deployment mode instantiates components of Loki
as distinct processes.
Each process is invoked specifying its target:
- ingester
- distributor
- query-frontend
- query-scheduler
- querier
- index-gateway
- ruler
- compactor
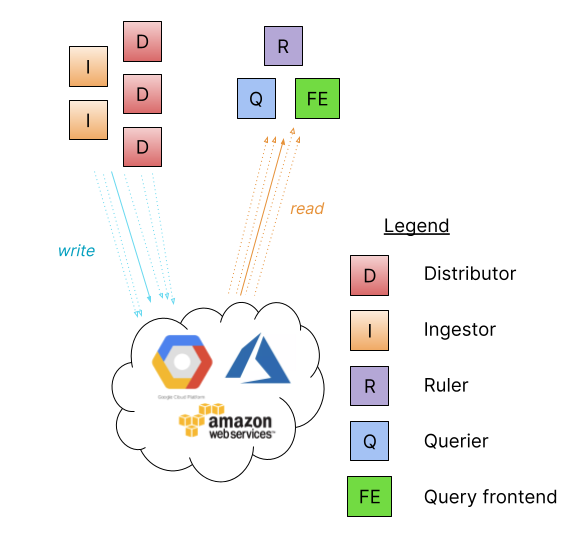
Running components as individual microservices allows scaling up by increasing the quantity of microservices. The customized cluster has better observability of the individual components. Microservices mode deployments are the most efficient Loki installations. However, they are also the most complex to set up and maintain.
Microservices mode is recommended for very large Loki clusters or for clusters that require more control over scaling and cluster operations.
Microservices mode works best with Kubernetes deployments. There are Jsonnet and distributed Helm chart installations.
Components

Distributor
The distributor service is responsible for handling incoming streams by clients. It’s the first stop in the write path for log data. Once the distributor receives a set of streams, each stream is validated for correctness and to ensure that it is within the configured tenant (or global) limits. Valid chunks are then split into batches and sent to multiple ingesters in parallel.
For more information, see the Distributor page.
Hashing
Distributors use consistent hashing in conjunction with a configurable replication factor to determine which instances of the ingester service should receive a given stream.
A stream is a set of logs associated to a tenant and a unique labelset. The stream is hashed using both the tenant ID and the labelset and then the hash is used to find the ingesters to send the stream to.
A hash ring stored in Consul is used to achieve consistent hashing; all ingesters register themselves into the hash ring with a set of tokens they own. Each token is a random unsigned 32-bit number. Along with a set of tokens, ingesters register their state into the hash ring. The state JOINING, and ACTIVE may all receive write requests, while ACTIVE and LEAVING ingesters may receive read requests. When doing a hash lookup, distributors only use tokens for ingesters who are in the appropriate state for the request.
To do the hash lookup, distributors find the smallest appropriate token whose value is larger than the hash of the stream. When the replication factor is larger than 1, the next subsequent tokens (clockwise in the ring) that belong to different ingesters will also be included in the result.
The effect of this hash set up is that each token that an ingester owns is responsible for a range of hashes. If there are three tokens with values 0, 25, and 50, then a hash of 3 would be given to the ingester that owns the token 25; the ingester owning token 25 is responsible for the hash range of 1-25.
Quorum consistency
Since all distributors share access to the same hash ring, write requests can be sent to any distributor.
To ensure consistent query results, Loki uses Dynamo-style quorum consistency on reads and writes. This means that the distributor will wait for a positive response of at least one half plus one of the ingesters to send the sample to before responding to the client that initiated the send.
Ingester
The ingester service is responsible for writing log data to long-term storage backends (DynamoDB, S3, Cassandra, etc.) on the write path and returning log data for in-memory queries on the read path.
Ingesters contain a lifecycler which manages the lifecycle of an ingester in
the hash ring. Each ingester has a state of either PENDING, JOINING,
ACTIVE, LEAVING, or UNHEALTHY:
Deprecated: the WAL (write ahead log) supersedes this feature
PENDINGis an Ingester’s state when it is waiting for a handoff from another ingester that isLEAVING.JOININGis an Ingester’s state when it is currently inserting its tokens into the ring and initializing itself. It may receive write requests for tokens it owns.ACTIVEis an Ingester’s state when it is fully initialized. It may receive both write and read requests for tokens it owns.LEAVINGis an Ingester’s state when it is shutting down. It may receive read requests for data it still has in memory.UNHEALTHYis an Ingester’s state when it has failed to heartbeat to Consul.UNHEALTHYis set by the distributor when it periodically checks the ring.
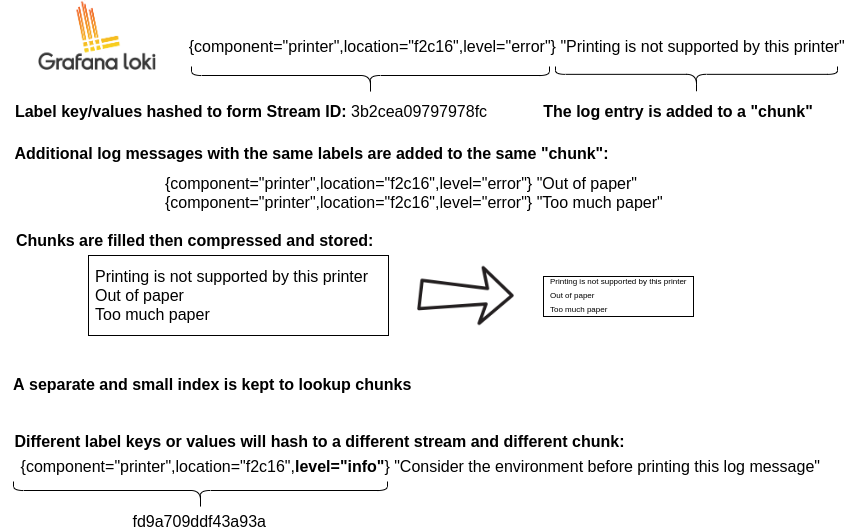
Each log stream that an ingester receives is built up into a set of many “chunks” in memory and flushed to the backing storage backend at a configurable interval.
Chunks are compressed and marked as read-only when:
- The current chunk has reached capacity (a configurable value).
- Too much time has passed without the current chunk being updated
- A flush occurs.
Whenever a chunk is compressed and marked as read-only, a writable chunk takes its place.
If an ingester process crashes or exits abruptly, all the data that has not yet been flushed will be lost. Loki is usually configured to replicate multiple replicas (usually 3) of each log to mitigate this risk.
When a flush occurs to a persistent storage provider, the chunk is hashed based on its tenant, labels, and contents. This means that multiple ingesters with the same copy of data will not write the same data to the backing store twice, but if any write failed to one of the replicas, multiple differing chunk objects will be created in the backing store. See Querier for how data is deduplicated.
Timestamp Ordering
Loki can be configured to accept out-of-order writes.
When not configured to accept out-of-order writes, the ingester validates that ingested log lines are in order. When an ingester receives a log line that doesn’t follow the expected order, the line is rejected and an error is returned to the user.
The ingester validates that log lines are received in timestamp-ascending order. Each log has a timestamp that occurs at a later time than the log before it. When the ingester receives a log that does not follow this order, the log line is rejected and an error is returned.
Logs from each unique set of labels are built up into “chunks” in memory and then flushed to the backing storage backend.
If an ingester process crashes or exits abruptly, all the data that has not yet
been flushed could be lost. Loki is usually configured with a Write Ahead Log which can be replayed on restart as well as with a replication_factor (usually 3) of each log to mitigate this risk.
When not configured to accept out-of-order writes, all lines pushed to Loki for a given stream (unique combination of labels) must have a newer timestamp than the line received before it. There are, however, two cases for handling logs for the same stream with identical nanosecond timestamps:
If the incoming line exactly matches the previously received line (matching both the previous timestamp and log text), the incoming line will be treated as an exact duplicate and ignored.
If the incoming line has the same timestamp as the previous line but different content, the log line is accepted. This means it is possible to have two different log lines for the same timestamp.
Handoff - Deprecated in favor of the WAL
By default, when an ingester is shutting down and tries to leave the hash ring, it will wait to see if a new ingester tries to enter before flushing and will try to initiate a handoff. The handoff will transfer all of the tokens and in-memory chunks owned by the leaving ingester to the new ingester.
Before joining the hash ring, ingesters will wait in PENDING state for a
handoff to occur. After a configurable timeout, ingesters in the PENDING state
that have not received a transfer will join the ring normally, inserting a new
set of tokens.
This process is used to avoid flushing all chunks when shutting down, which is a slow process.
Filesystem Support
While ingesters do support writing to the filesystem through BoltDB, this only works in single-process mode as queriers need access to the same back-end store and BoltDB only allows one process to have a lock on the DB at a given time.
Query frontend
The query frontend is an optional service providing the querier’s API endpoints and can be used to accelerate the read path. When the query frontend is in place, incoming query requests should be directed to the query frontend instead of the queriers. The querier service will be still required within the cluster, in order to execute the actual queries.
The query frontend internally performs some query adjustments and holds queries in an internal queue. In this setup, queriers act as workers which pull jobs from the queue, execute them, and return them to the query-frontend for aggregation. Queriers need to be configured with the query frontend address (via the -querier.frontend-address CLI flag) in order to allow them to connect to the query frontends.
Query frontends are stateless. However, due to how the internal queue works, it’s recommended to run a few query frontend replicas to reap the benefit of fair scheduling. Two replicas should suffice in most cases.
Queueing
The query frontend queuing mechanism is used to:
- Ensure that large queries, that could cause an out-of-memory (OOM) error in the querier, will be retried on failure. This allows administrators to under-provision memory for queries, or optimistically run more small queries in parallel, which helps to reduce the TCO.
- Prevent multiple large requests from being convoyed on a single querier by distributing them across all queriers using a first-in/first-out queue (FIFO).
- Prevent a single tenant from denial-of-service-ing (DOSing) other tenants by fairly scheduling queries between tenants.
Splitting
The query frontend splits larger queries into multiple smaller queries, executing these queries in parallel on downstream queriers and stitching the results back together again. This prevents large (multi-day, etc) queries from causing out of memory issues in a single querier and helps to execute them faster.
Caching
Metric Queries
The query frontend supports caching metric query results and reuses them on subsequent queries. If the cached results are incomplete, the query frontend calculates the required subqueries and executes them in parallel on downstream queriers. The query frontend can optionally align queries with their step parameter to improve the cacheability of the query results. The result cache is compatible with any loki caching backend (currently memcached, redis, and an in-memory cache).
Log Queries - Coming soon!
Caching log (filter, regexp) queries are under active development.
Querier
The querier service handles queries using the LogQL query language, fetching logs both from the ingesters and from long-term storage.
Queriers query all ingesters for in-memory data before falling back to running the same query against the backend store. Because of the replication factor, it is possible that the querier may receive duplicate data. To resolve this, the querier internally deduplicates data that has the same nanosecond timestamp, label set, and log message.
Chunk Format
  -------------------------------------------------------------------
  |                               |                                 |
  |        MagicNumber(4b)        |           version(1b)           |
  |                               |                                 |
  -------------------------------------------------------------------
  |         block-1 bytes         |          checksum (4b)          |
  -------------------------------------------------------------------
  |         block-2 bytes         |          checksum (4b)          |
  -------------------------------------------------------------------
  |         block-n bytes         |          checksum (4b)          |
  -------------------------------------------------------------------
  |                        #blocks (uvarint)                        |
  -------------------------------------------------------------------
  | #entries(uvarint) | mint, maxt (varint) | offset, len (uvarint) |
  -------------------------------------------------------------------
  | #entries(uvarint) | mint, maxt (varint) | offset, len (uvarint) |
  -------------------------------------------------------------------
  | #entries(uvarint) | mint, maxt (varint) | offset, len (uvarint) |
  -------------------------------------------------------------------
  | #entries(uvarint) | mint, maxt (varint) | offset, len (uvarint) |
  -------------------------------------------------------------------
  |                      checksum(from #blocks)                     |
  -------------------------------------------------------------------
  |                    #blocks section byte offset                  |
  -------------------------------------------------------------------
mint and maxt describe the minimum and maximum Unix nanosecond timestamp,
respectively.
Block Format
A block is comprised of a series of entries, each of which is an individual log line.
Note that the bytes of a block are stored compressed using Gzip. The following is their form when uncompressed:
  -------------------------------------------------------------------
  |    ts (varint)    |     len (uvarint)    |     log-1 bytes      |
  -------------------------------------------------------------------
  |    ts (varint)    |     len (uvarint)    |     log-2 bytes      |
  -------------------------------------------------------------------
  |    ts (varint)    |     len (uvarint)    |     log-3 bytes      |
  -------------------------------------------------------------------
  |    ts (varint)    |     len (uvarint)    |     log-n bytes      |
  -------------------------------------------------------------------
ts is the Unix nanosecond timestamp of the logs, while len is the length in
bytes of the log entry.
Storage
Single Store
Loki stores all data in a single object storage backend. This mode of operation became generally available with Loki 2.0 and is fast, cost-effective, and simple, not to mention where all current and future development lies. This mode uses an adapter called boltdb_shipper to store the index in object storage (the same way we store chunks).
Deprecated: Multi-store
The chunk store is Loki’s long-term data store, designed to support interactive querying and sustained writing without the need for background maintenance tasks. It consists of:
- An index for the chunks. This index can be backed by:
- A key-value (KV) store for the chunk data itself, which can be:
Unlike the other core components of Loki, the chunk store is not a separate service, job, or process, but rather a library embedded in the two services that need to access Loki data: the ingester and querier.
The chunk store relies on a unified interface to the “NoSQL” stores (DynamoDB, Bigtable, and Cassandra) that can be used to back the chunk store index. This interface assumes that the index is a collection of entries keyed by:
- A hash key. This is required for all reads and writes.
- A range key. This is required for writes and can be omitted for reads, which can be queried by prefix or range.
The interface works somewhat differently across the supported databases:
- DynamoDB supports range and hash keys natively. Index entries are thus modelled directly as DynamoDB entries, with the hash key as the distribution key and the range as the DynamoDB range key.
- For Bigtable and Cassandra, index entries are modelled as individual column values. The hash key becomes the row key and the range key becomes the column key.
A set of schemas are used to map the matchers and label sets used on reads and writes to the chunk store into appropriate operations on the index. Schemas have been added as Loki has evolved, mainly in an attempt to better load balance writes and improve query performance.
Read Path
To summarize, the read path works as follows:
- The querier receives an HTTP/1 request for data.
- The querier passes the query to all ingesters for in-memory data.
- The ingesters receive the read request and return data matching the query, if any.
- The querier lazily loads data from the backing store and runs the query against it if no ingesters returned data.
- The querier iterates over all received data and deduplicates, returning a final set of data over the HTTP/1 connection.
Write Path
To summarize, the write path works as follows:
- The distributor receives an HTTP/1 request to store data for streams.
- Each stream is hashed using the hash ring.
- The distributor sends each stream to the appropriate ingesters and their replicas (based on the configured replication factor).
- Each ingester will create a chunk or append to an existing chunk for the stream’s data. A chunk is unique per tenant and per labelset.
- The distributor responds with a success code over the HTTP/1 connection.
Was this page helpful?
Related resources from Grafana Labs

