
Important: This documentation is about an older version. It's relevant only to the release noted, many of the features and functions have been updated or replaced. Please view the current version.
Beyla configuration options
Beyla can be configured via environment variables or via
a YAML configuration file that is passed with the -config command-line
argument. Environment variables have priority over the properties in the
configuration file. For example, in the following command line, the BEYLA_OPEN_PORT option,
is used to override any open_port settings inside the config.yaml file:
$ BEYLA_OPEN_PORT=8080 beyla -config /path/to/config.yamlAt the end of this document, there is an example of YAML configuration file.
Currently, Beyla consist of a pipeline of components which generate, transform, and export traces from HTTP and GRPC services. In the YAML configuration, each component has its own first-level section.
The architecture below shows the different components of Beyla. The dashed boxes in the diagram below can be enabled and disabled according to the configuration.
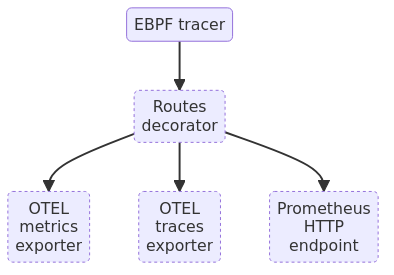
A quick description of the components:
- Process discovery searches for instrumentable processes matching a given criteria.
- EBPF tracer instruments the HTTP and GRPC services of an external process, creates service traces and forwards them to the next stage of the pipeline.
- Routes decorator will match HTTP paths (e.g.
/user/1234/info) into user-provided HTTP routes (e.g./user/{id}/info). If no routes are defined, the incoming data will be directly forwarded to the next stage. - OTEL metrics exporter exports metrics data to an external OpenTelemetry metrics collector.
- OTEL traces exporter exports span data to an external OpenTelemetry traces collector.
- Prometheus HTTP endpoint enables an HTTP endpoint that allows any external scraper to pull metrics in Prometheus format.
- Internal metrics reporter optionally reports metrics about the internal behavior of the auto-instrumentation tool in Prometheus format.
The following sections explain the global configuration properties, as well as the options for each component.
Global configuration properties
The properties in this section are first-level YAML properties, as they apply to the whole Beyla configuration:
Selects the process to instrument by the executable name path. This property accepts a regular expression to be matched against the full executable command line, including the directory where the executable resides on the file system.
This property is used to select a single process to instrument, or a group of processes of similar characteristics. For more fine-grained process selection and grouping, you can follow the instructions in the service discovery section.
If the open_port property is set, the executable to be selected needs to match both properties.
When instrumenting by using the executable name, choose a non-ambiguous name, a name that
will match a single executable on the target system.
For example, if you set BEYLA_EXECUTABLE_NAME=server, and you have running two processes whose executables
have the following paths:
/usr/local/bin/language-server
/opt/app/server
Beyla will match indistinctly one of the above processes and instrument both.
If you just want to instrument one of them, you should be as concrete as possible about
the value of the setting. For example, BEYLA_EXECUTABLE_NAME=/opt/app/server
or just BEYLA_EXECUTABLE_NAME=/server.
Selects the process to instrument by the port it has open (listens to). This property
accepts a comma-separated list of ports (for example, 80), and port ranges (for example, 8000-8999).
If the executable matching only one of the ports in the list, it is considered to match
the selection criteria.
For example, specifying the following property:
open_port: 80,443,8000-8999Would make Beyla to select any executable that opens port 80, 443, or any of the ports between 8000 and 8999 included.
This property is used to select a single process to instrument, or a group of processes of similar characteristics. For more fine-grained process selection and grouping, you can follow the instructions in the service discovery section.
If the executable_name property is set, the executable to be selected needs to match both properties.
If an executable opens multiple ports, only one of the ports needs to be specified for Beyla to instrument all the HTTP/S and GRPC requests on all application ports. At the moment, there is no way to restrict the instrumentation only to the methods exposed through a specific port.
If the specified port range is wide (e.g. 1-65535) Beyla will try to execute all the processes
owning one of the ports in the range.
Overrides the name of the instrumented service to be reported by the metrics exporter. If unset, it will be the name of the executable of the service.
If a single instance of Beyla is instrumenting multiple instances of different processes, they will share the same service name even if they are different. If you need that a single instance of Beyla report different service names, follow the instructions in the service discovery section.
Optionally, allows assigning a namespace for the service selected from the executable_name
or open_port properties. This will assume a single namespace for all the services instrumented
by Beyla. If you need that a single instance of Beyla groups multiple services
into different namespaces, follow the instructions in the
service discovery section.
It is important to notice that this namespace is not a selector for Kubernetes namespaces. Its
value will be use to set the value of standard telemetry attributes. For example, the
OpenTelemetry service.namespace attribute.
Sets the verbosity level of the process standard output logger.
Valid log level values are: DEBUG, INFO, WARN and ERROR.
DEBUG being the most verbose and ERROR the least verbose.
If true, prints any instrumented trace on the standard output (stdout).
Process discovery
The executable_name, open_port, service_name and service_namespace are top-level
properties that simplify the configuration of Beyla to instrument a single service, or
a group of related services.
In some scenarios, Beyla will instrument a big variety of services; for example,
as a Kubernetes DaemonSet that instruments all
the services in a node. The discovery YAML section will let you specify a higher
differentiation degree in the services that Beyla can instrument.
For example, it will allow overriding the service name and namespace per service type.
This section allows specifying different selection criteria for different services, as well as overriding some of their metadata, such as their reported name or namespace.
For more details about this section, please go to the discovery services section of this document.
Disables the detection of Go specifics when ebpf tracer inspects executables to be instrumented. The tracer will fallback to using generic instrumentation, which will generally be less efficient.
Discovery services section
Example of YAML file allowing the selection of multiple groups of services:
discovery:
  services:
    - exe_path_regexp: (worker)|(backend)|(frontend)
      namespace: MyApplication
    - exe_path_regexp: loadgen
      namespace: testing
      name: "TestLoadGenerator"
The above example YAML will select two groups of executables. The first group will be formed by any
process whose executable path contains the worker, backend or frontend text. For each
service, Beyla will take the service name attribute from the executable name. The reported
service namespace for all the processes matching this group will be MyApplication.
The second group in the above example YAML will select any executable whose path contains
regexp, but instead of taking the service name from the executable name, it will override
the service name with TestLoadGenerator.
The rest of this section describes the properties that are accepted in each entry of the
services list.
Selects the process to instrument by the port it has open (listens to). This property
accepts a comma-separated list of ports (for example, 80), and port ranges (for example, 8000-8999).
If the executable matching only one of the ports in the list, it is considered to match
the selection criteria.
For example, specifying the following property:
open_port: 80,443,8000-8999Would make Beyla to select any executable that opens port 80, 443, or any of the ports between 8000 and 8999 included.
If the exe_path_regexp property is set, the executables to be selected need to match both properties.
If an executable opens multiple ports, only one of the ports needs to be specified for Beyla to instrument all the HTTP/S and GRPC requests on all application ports. At the moment, there is no way to restrict the instrumentation only to the methods exposed through a specific port.
Selects the processes to instrument by their executable name path. This property accepts a regular expression to be matched against the full executable command line, including the directory where the executable resides on the file system.
If the open_port property is set, the executables to be selected need to match both properties.
Beyla will try to instrument all the processes with an executable path matching this property.
For example, setting exe_path_regexp: .* will make Beyla to try to instrument all the
executables in the host.
Defines a name for the instrumented service. If unset, it will take the name of the executable process.
If set, and multiple processes match the above open_ports or exe_path_regexp selectors,
the metrics and traces for all the instances will share the same service name.
Defines a namespace for the matching service. If unset, it will be left empty.
It is important to notice that this namespace is not a selector for Kubernetes namespaces. Its
value will be use to set the value of standard telemetry attributes. For example, the
OpenTelemetry service.namespace attribute.
EBPF tracer
YAML section ebpf.
Specifies how many messages need to be accumulated in the eBPF ringbuffer before sending a wake-up request to the user space code.
In high-load services (in terms of requests/second), tuning this option to higher values can help with reducing the CPU overhead of Beyla.
In low-load services (in terms of requests/second), high values of wakeup_len could
add a noticeable delay in the time the metrics are submitted and become externally visible.
Enables tracking of request headers for the purposes of processing any incoming ‘Traceparent’ header values. If this option is enabled, when Beyla encounters an incoming server request with a ‘Traceparent’ header value, it will use the provided ’trace id’ to create its own trace spans.
This option does not have an effect on Go applications, where the ‘Traceparent’ field is always processed, without additional tracking of the request headers.
Enabling this option may increase Beyla’s performance overhead in high request volume scenarios. Please note that this option is only useful when generating Beyla traces, it does not affect generation of Beyla metrics.
Configuration of metrics and traces attributes
Grafana Beyla allows configuring how some attributes for metrics and traces
are decorated. Under the attributes top YAML sections, you can enable
other subsections configure how some attributes are set.
Instance ID decoration
The metrics and the traces are decorated with a unique instance ID string, identifying
each instrumented application. By default, Beyla uses the host name that runs Beyla
(can be a container or Pod name), followed by the PID of the instrumented process;
but you can override how the instance ID is composed in the
instance_id YAML subsection under the attributes top-level section.
For example:
attributes:
  instance_id:
dns: falseIf true, it will try to resolve the Beyla local hostname against the network DNS.
If false, it will use the local hostname.
If set, the host part of the Instance ID will use the provided string instead of trying to automatically resolve the host name.
This option takes precedence over dns.
If set, Beyla will use this value directly as instance ID of any instrumented process. If you are managing multiple processes from a single Beyla instance, all the processes will have the same instance ID.
Routes decorator
YAML section routes.
This section can be only configured via the YAML file. If no routes section is provided in
the YAML file, a default routes’ pipeline stage will be created and filtered with the wildcard
routes decorator.
Will match the provided URL path patterns and set the http.route trace/metric
property accordingly. You should use the routes property
whenever possible to reduce the cardinality of generated metrics.
Each route pattern is a URL path with specific tags which allow for grouping path
segments. The matcher tags can be in the :name or {name} format.
For example, if you define the following patterns:
routes:
  patterns:
    - /user/{id}
    - /user/{id}/basket/{product}
Traces with the following HTTP paths will include the same http.route='/user/{id}' property:
/user/123
/user/456
Traces with the following HTTP paths will include the same http.route='/user/{id}'/basket/{product}
property:
/user/123/basket/1
/user/456/basket/3
Additionally, the route matcher also supports the wildcard character *, which can be used to
match path prefixes. For example, if you define the following pattern:
routes:
  patterns:
    - /user/*
Any traces with HTTP paths starting with /user (including /user itself) will be matched to the
route /user/*. As per the example above, all of the following paths will be matched as /user/*:
/user
/user/123
/user/123/basket/1
/user/456/basket/3Will match the provided URL path against the defined patterns, and discard the trace and/or metric events if
they match any of the ignored_patterns. The format for the ignored_patterns field is identical
to the patterns field described above. You can define the ignored patterns with or without
any of the wildcard options. For example, if you define the following ignored patterns:
routes:
  ignored_patterns:
    - /health
    - /v1/*
Any event paths which have a prefix of /v1 or are equal to /health will be ignored.
This option is very useful if you want to prevent certain paths used development or service health monitoring, to be recorded as traces or metrics.
This property can be used together with the ignored_patterns property to refine which type of events are ignored.
Possible values for the ignore_mode property are:
allwill discard both metrics and traces which match theignored_patterns.traceswill discard only the traces which match theignored_patterns. No metric events will be ignored.metricswill discard only the metrics which match theignored_patterns. No trace events will be ignored.
Selectively ignoring only certain type of events might be useful in certain scenarios. For example, you may want to
know the performance metrics of your health check API, but you wouldn’t want the overhead of those trace records in
your target traces database. In this this example scenario, you would set the ignore_mode property to traces, such
that only traces matching the ignored_patterns will be discarded, while metrics will still be recorded.
Specifies what to do when a trace HTTP path does not match any of the patterns entries.
Possible values for the unmatched property are:
unsetwill leave thehttp.routeproperty as unset.pathwill copy thehttp.routefield property to the path value.- 🚨 Caution: this option could lead to cardinality explosion at the ingester side.
wildcardwill set thehttp.routefield property to a generic asterisk based/**value.heuristicwill automatically derive thehttp.routefield property from the path value, based on the following rules:- Any path components which have numbers or characters outside of the ASCII alphabet (or
-and_), will be replaced by an asterisk*. - Any alphabetical components which don’t look like words, will be replaced by an asterisk
*.
- Any path components which have numbers or characters outside of the ASCII alphabet (or
Special considerations when using the heuristic route decorator mode
The heuristic decorator is a best effort route decorator, which may still lead to cardinality explosion in certain scenarios.
For example, the GitHub URL paths are a good example where the heuristic route decorator will not work, since the URL paths
are constructed like a directory tree. In this scenario all paths will remain unique and lead to cardinality explosion.
On the other hand, if your URL path patterns follow certain structure, and the unique IDs are made up of numbers or random characters,
then the heuristic decorator may be a low effort configuration option which is suitable for your use-case. For example, the following
mock Google Docs URLs will be correctly reduced to a low cardinality version:
Both URL paths below:
document/d/CfMkAGbE_aivhFydEpaRafPuGWbmHfG/edit (no numbers in the ID)
document/d/C2fMkAGb3E_aivhFyd5EpaRafP123uGWbmHfG/edit
will be converted to a low cardinality route:
document/d/*/editOTEL metrics exporter
YAML section otel_metrics_export.
This component exports OpenTelemetry metrics to a given endpoint. It will be enabled if
its endpoint attribute is set (either via an YAML configuration file or via environment variables).
In addition to the properties exposed in this section, this component implicitly supports the environment variables from the standard OTEL exporter configuration.
Specifies the OpenTelemetry endpoint where metrics will be sent. If you plan to send the metrics directly to the Grafana Cloud OpenTelemetry endpoint, you might prefer to use the configuration options in the Using the Grafana Cloud OTEL endpoint to ingest metrics and traces section.
The OTEL_EXPORTER_OTLP_ENDPOINT environment variable sets a common endpoint for both the metrics and the
traces exporters. The OTEL_EXPORTER_OTLP_METRICS_ENDPOINT environment variable,
or the endpoint YAML, property will set the endpoint only for the metrics exporter node,
such that the traces’ exporter won’t be activated unless explicitly specified.
According to the OpenTelemetry standard, if you set the endpoint via the OTEL_EXPORTER_OTLP_ENDPOINT environment variable,
the OpenTelemetry exporter will automatically add the /v1/metrics path to the URL. If you want to avoid this
addition, you can use either the OTEL_EXPORTER_OTLP_METRICS_ENDPOINT environment variable or the environment YAML
property to use exactly the provided URL without any addition.
Specifies the transport/encoding protocol of the OpenTelemetry endpoint.
The accepted values, as defined by the OTLP Exporter Configuration document are http/json, http/protobuf and grpc.
The OTEL_EXPORTER_OTLP_PROTOCOL environment variable sets a common protocol for both the metrics and
traces exporters. The OTEL_EXPORTER_OTLP_METRICS_PROTOCOL environment variable,
or the protocol YAML property, will set the protocol only for the metrics exporter node.
If this property is not provided, Beyla will guess it according to the following rules:
- Beyla will guess
grpcif the port ends in4317(4317,14317,24317, …), as4317is the usual Port number for the OTEL GRPC collector. - Beyla will guess
http/protobufif the port ends in4318(4318,14318,24318, …), as4318is the usual Port number for the OTEL HTTP collector.
Controls whether the OTEL client verifies the server’s certificate chain and host name.
If set to true, the OTEL client accepts any certificate presented by the server
and any host name in that certificate. In this mode, TLS is susceptible to a man-in-the-middle
attacks. This option should be used only for testing and development purposes.
Configures the intervening time between exports.
Specifies whether the exporter must submit http.target as a metric attribute.
According to the standard OpenTelemetry specification, http.target is the full HTTP request
path and query arguments.
It is disabled by default to avoid cardinality explosion in paths with IDs. As an alternative, it is recommended to group these requests in the routes’ node.
Specifies whether the exporter must submit the caller peer address as a metric attribute.
It is disabled by default to avoid cardinality explosion.
The buckets object allows overriding the bucket boundaries of diverse histograms. See
Overriding histogram buckets section for more details.
Overriding histogram buckets
For both OpenTelemetry and Prometheus metrics exporters, you can override the histogram bucket
boundaries via a configuration file (see buckets YAML section of your metrics exporter configuration).
Sets the bucket boundaries for the metrics related to the request duration. Specifically:
http.server.duration(OTEL) /http_server_duration_seconds(Prometheus)http.client.duration(OTEL) /http_client_duration_seconds(Prometheus)rpc.server.duration(OTEL) /rpc_server_duration_seconds(Prometheus)rpc.client.duration(OTEL) /rpc_client_duration_seconds(Prometheus)
If the value is unset, the default bucket boundaries follow the recommendation from the OpenTelemetry semantic conventions
0, 0.005, 0.01, 0.025, 0.05, 0.075, 0.1, 0.25, 0.5, 0.75, 1, 2.5, 5, 7.5, 10Sets the bucket boundaries for the metrics related to request sizes. This is:
http.server.request.size(OTEL) /http_server_request_size_bytes(Prometheus)http.client.request.size(OTEL) /http_client_request_size_bytes(Prometheus)
If the value is unset, the default bucket boundaries are:
0, 32, 64, 128, 256, 512, 1024, 2048, 4096, 8192The default values are UNSTABLE and could change if Prometheus or OpenTelemetry semantic conventions recommend a different set of bucket boundaries.
OTEL traces exporter
YAML section otel_traces_export.
This component exports OpenTelemetry traces to a given endpoint. It will be enabled if
its endpoint attribute is set (either via an YAML configuration file or via environment variables).
In addition to the properties exposed in this section, this component implicitly supports the environment variables from the standard OTEL exporter configuration.
Specifies the OpenTelemetry endpoint where the traces will be sent. If you plan to send the metrics directly to the Grafana Cloud OpenTelemetry endpoint, you might prefer to use the configuration options in the Using the Grafana Cloud OTEL endpoint to ingest metrics and traces section.
The OTEL_EXPORTER_OTLP_ENDPOINT environment variable sets a common endpoint for both the
metrics and the traces exporters. The OTEL_EXPORTER_OTLP_TRACES_ENDPOINT environment variable
or the endpoint YAML property, will set the endpoint only for the traces’ exporter node,
so the metrics exporter won’t be activated unless explicitly specified.
According to the OpenTelemetry standard, if you set the endpoint via the OTEL_EXPORTER_OTLP_ENDPOINT environment variable,
the OpenTelemetry exporter will automatically add the /v1/traces path to the URL. If you want to avoid this
addition, you can use either the OTEL_EXPORTER_OTLP_TRACES_ENDPOINT environment variable or the environment YAML
property to use exactly the provided URL without any addition.
Specifies the transport/encoding protocol of the OpenTelemetry traces endpoint.
The accepted values, as defined by the OTLP Exporter Configuration document are http/json, http/protobuf and grpc.
The OTEL_EXPORTER_OTLP_PROTOCOL environment variable sets a common protocol for both the metrics and
the traces exporters. The OTEL_EXPORTER_OTLP_TRACES_PROTOCOL environment variable,
or the protocol YAML property, will set the protocol only for the traces’ exporter node.
If this property is not provided, Beyla will guess it according to the following rules:
- Beyla will guess
grpcif the port ends in4317(4317,14317,24317, …), as4317is the usual Port number for the OTEL GRPC collector. - Beyla will guess
http/protobufif the port ends in4318(4318,14318,24318, …), as4318is the usual Port number for the OTEL HTTP collector.
Controls whether the OTEL client verifies the server’s certificate chain and host name.
If set to true, the OTEL client accepts any certificate presented by the server
and any host name in that certificate. In this mode, TLS is susceptible to a man-in-the-middle
attacks. This option should be used only for testing and development purposes.
Sampling policy
Beyla accepts the standard OpenTelemetry environment variables to configure the sampling ratio of traces.
In addition, you can configure the sampling under the sampler YAML subsection of the
otel_traces_export section. For example:
otel_traces_export:
  sampler:
    name: "traceidratio"
    arg: "0.1"
If you are using the Grafana Agent as your OTEL collector, you can configure the sampling policy at that level instead.
Specifies the name of the sampler. It accepts the following standard sampler names from the OpenTelemetry specification:
always_on: samples every trace. Be careful about using this sampler in an application with significant traffic: a new trace will be started and exported for every request.always_off: samples no traces.traceidratio: samples a given fraction of traces (specified by theargproperty that is explained below). The fraction must be a real value between 0 and 1. For example, a value of"0.5"would sample 50% of the traces. Fractions >= 1 will always sample. Fractions < 0 are treated as zero. To respect the parent trace’s sampling configuration, theparentbased_traceidratiosampler should be used.parentbased_always_on(default): parent-based version ofalways_onsampler (see explanation below).parentbased_always_off: parent-based version ofalways_offsampler (see explanation below).parentbased_traceidratio: parent-based version oftraceidratiosampler (see explanation below).
Parent-based samplers are composite samplers which behave differently based on the parent of the traced span. If the span has no parent, the root sampler is used to make sampling decision. If the span has a parent, the sampling configuration would depend on the sampling parent.
Specifies the argument of the selected sampler. Currently, only traceidratio
and parentbased_traceidratio require an argument.
In YAML, this value MUST be provided as a string, so even if the value
is numeric, make sure that it is enclosed between quotes in the YAML file,
(for example, arg: "0.25").
Using the Grafana Cloud OTEL endpoint to ingest metrics and traces
You can use the standard OpenTelemetry variables to submit the metrics and traces to any standard OpenTelemetry endpoint, including Grafana Cloud.
Alternatively, Beyla can be configured to submit OpenTelemetry data to the Grafana Cloud OTEL endpoint using its own custom variables, allowing an easier setup of the endpoint and the authentication.
The properties can be defined via environment variables, or under the
grafana top-level YAML section, otlp subsection. For example:
grafana:
  otlp:
    cloud_zone: prod-eu-west-0
cloud_instance_id: 123456Accepts a list of strings with the kind of data that will be submitted to the
OTLP endpoint. It accepts metrics and/or traces as values.
The cloud zone of your Grafana endpoint. This will be used to compose the
Grafana OTLP URL. For example, if the value is prod-eu-west-0, the
used OTLP URL will be https://otlp-gateway-prod-eu-west-0.grafana.net/otlp.
If any of the OTEL_EXPORTER_OTLP_ENDPOINT, OTEL_EXPORTER_OTLP_METRICS_ENDPOINT
or OTEL_EXPORTER_OTLP_TRACES_ENDPOINT variables are defined, they will
override the destination endpoint, so the cloud_zone configuration option
will be ignored.
Your Grafana user name. It is usually a number but it must be set as a string inside the YAML file.
API key of your Grafana Cloud account.
Prometheus HTTP endpoint
YAML section prometheus_export.
This component opens an HTTP endpoint in the auto-instrumentation tool
that allows any external scraper to pull metrics in Prometheus
format. It will be enabled if the port property is set.
Specifies the HTTP port for the Prometheus scrape endpoint. If unset or 0, no Prometheus endpoint will be open.
Specifies the HTTP query path to fetch the list of Prometheus metrics.
Specifies whether the exporter must submit http_target as a metric attribute.
To be consistent with the OpenTelemetry specification, http_target is the full HTTP request
path and query arguments.
It is disabled by default to avoid cardinality explosion in paths with IDs. As an alternative, it is recommended to group these requests in the routes’ node.
Specifies whether the exporter must submit the caller peer address as a metric attribute.
It is disabled by default to avoid cardinality explosion.
The buckets object allows overriding the bucket boundaries of diverse histograms. See
Overriding histogram buckets section for more details.
Internal metrics reporter
YAML section internal_metrics.
This component will report certain internal metrics about the behavior
of the auto-instrumentation tool, and expose them as a Prometheus
scraper. It will be enabled if the port property is set.
Specifies the HTTP port for the Prometheus scrape endpoint. If unset or 0, no Prometheus endpoint will be open and no metrics will be accounted.
Its value can be the same as prometheus_export.port (both metric families
will share the same HTTP server, though they can be accessed in different paths),
or a different value (two different HTTP servers for the different metric families).
Specifies the HTTP query path to fetch the list of Prometheus metrics.
If prometheus_export.port and internal_metrics.port have the
same values, this internal_metrics.path value can be
different from prometheus_export.path, to keep both metric families separated,
or the same (both metric families will be listed in the same scrape endpoint).
YAML file example
open_port: 443
service_name: my-instrumented-service
log_level: DEBUG

ebpf:
  wakeup_len: 100

otel_traces_export:
  endpoint: https://otlp-gateway-prod-eu-west-0.grafana.net/otlp

prometheus_export:
  port: 8999
  path: /metrics

