Important: This documentation is about an older version. It's relevant only to the release noted, many of the features and functions have been updated or replaced. Please view the current version.
Beyla export modes
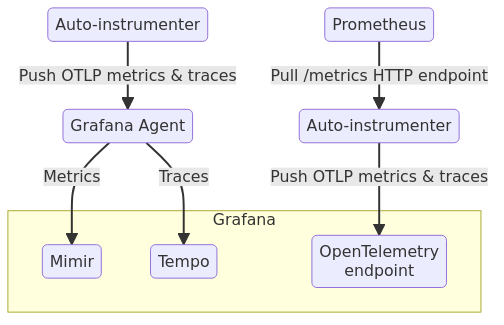
Beyla can export data in two modes:
- Agent mode (recommended mode): the auto-instrumentation tool will send the metrics and the traces to the Grafana Agent, which will process and send them to Mimir and Tempo. In this scenario, the Agent takes care of the authentication required by the Grafana Mimir/Tempo endpoints. This mode also integrates better with some Grafana exclusive features, such as the span-to-metrics and span-to-service graph converters.
- Direct mode: the auto-instrumentation tool can push metrics and/or traces directly to a remote endpoint (using the OpenTelemetry/OTEL protocols) or expose a Prometheus HTTP endpoint ready to be scraped (i.e. pull mode). In the direct OTEL push mode, the auto-instrumentation tool needs to be configured with the authentication credentials.
Running in Direct mode
You can follow our quick start tutorial for a quick introduction to auto-instrumentation in Direct mode, by using OpenTelemetry. The OTLP endpoint authentication credentials are provided by using the following environment variables:
OTEL_EXPORTER_OTLP_ENDPOINTOTEL_EXPORTER_OTLP_HEADERS
To run in Direct mode by using the Prometheus scrape endpoint, please refer to the configuration documentation.
Running in Agent mode
ℹ️ This tutorial assumes that both the Agent and the auto-instrumentation tool are installed as local Linux OS executables. For further examples on downloading and running the auto-instrumentation tool as an OCI container, you can check the documentation sections on running the Beyla as a Docker container or running Beyla in Kubernetes.
First, you will need to locally install and configure the Grafana Agent in Flow mode, according to the latest documentation. Running the Agent in Flow mode will facilitate the ingestion of OpenTelemetry metrics and traces from the auto-instrumentation tool, as well as process and forward to the different Grafana product endpoints (Mimir and/or Tempo).
Configuring the Agent pipeline
Next, you’ll need to specify the following nodes by using the River configuration language:
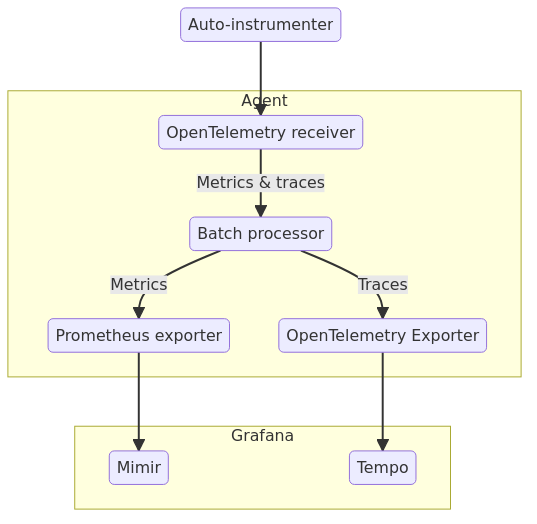
You can download the example of the whole River configuration file, which will be explained in the rest of this section.
The Agent needs to expose an OpenTelemetry receiver endpoint, such that the auto-instrumentation tool can forward both metrics and traces. The Agent configuration file will need to include the following entry:
otelcol.receiver.otlp "default" {
  grpc {}
  http {}

  output {
    metrics = [otelcol.processor.batch.default.input]
    traces = [otelcol.processor.batch.default.input]
  }
}
This enables reception of OpenTelemetry events via GRPC and HTTP, which will be forwarded to the next stage in the pipeline, the Batch processor, which will then accumulate the messages and forward them to the exporters:
otelcol.processor.batch "default" {
  output {
    metrics = [otelcol.exporter.prometheus.default.input]
    traces  = [otelcol.exporter.otlp.tempo.input]
  }
}
You can export either metrics, traces, or both. If you only want to export a single
type of data, you can just avoid the metrics or traces lines in the previous
node definitions, and ignore some of the following exporters.
The metrics are exported in Prometheus format to Grafana Mimir. The configuration entry will need to specify an endpoint with basic authentication. In the provided example, the endpoint and the credentials are provided via environment variables:
otelcol.exporter.prometheus "default" {
    forward_to = [prometheus.remote_write.mimir.receiver]
}

prometheus.remote_write "mimir" {
  endpoint {
    url = "https://" + env("MIMIR_ENDPOINT") + "/api/prom/push"
    basic_auth {
      username = env("MIMIR_USER")
      password = env("GRAFANA_API_KEY")
    }
  }
}
Assuming you have a configuration file as above, you will need to run the Agent with the environment variables set. For example:
export MIMIR_USER=734432
export MIMIR_ENDPOINT=prometheus-prod-01-eu-west-0.grafana.net
export GRAFANA_API_KEY=VHJhbGFyw60gcXVlIHRlIHbD....=
Finally, to export the traces, you will need to set up a Grafana Tempo exporter and an endpoint, also configured via environment variables:
otelcol.exporter.otlp "tempo" {
    client {
        endpoint = env("TEMPO_ENDPOINT")
        auth     = otelcol.auth.basic.creds.handler
    }
}

otelcol.auth.basic "creds" {
    username = env("TEMPO_USER")
    password = env("GRAFANA_API_KEY")
}
Please note that the TEMPO_ENDPOINT and TEMPO_USER values are different
from MIMIR_ENDPOINT and MIMIR_USER.
To run the agent with the previous configuration (for example, written in a file
named agent-config.river), you need to run the following command:
agent run agent-config.riverConfiguring and running the auto-instrumentation tool
Now we can configure the auto-instrumentation tool to forward data to the running Grafana Agent. In this tutorial we are assuming that both the auto-instrumentation tool and the Agent are running on the same host, so there is no need to secure the traffic nor provide authentication in the Agent OTLP receiver.
You can configure the auto-instrumentation tool both via environment variables or via a configuration YAML file, which is what we will use in this example. Please refer to the complete Configuration documentation for more detailed description of each configuration option.
You can download the whole example configuration file, which we will explain in the rest of this section.
First, you will need to specify the executable to instrument. If, for example,
the service executable is a process that opens the port 443, you can use the open_port
property of the YAML document:
open_port: 443The auto-instrumentation tool will automatically search and instrument the process listening on port 443.
Next, you will need to specify where the traces and the metrics will be submitted. If
the Agent is running on the local host, it will use the port 4318:
otel_metrics_export:
  endpoint: http://localhost:4318
otel_traces_export:
  endpoint: http://localhost:4318
You can specify both otel_metrics_export and otel_traces_export properties to
allow exporting both metrics and traces, or only one of them to export either
metrics or traces.
To run the auto-instrumentation tool (previously downloaded from the Beyla releases page),
you will need to specify the path to the configuration YAML file. For example instrument-config.yml:
beyla -config instrument-config.ymlWas this page helpful?
Related resources from Grafana Labs