Run Beyla in Kubernetes using Grafana Alloy Helm’s chart
Grafana Alloy is a vendor-neutral distribution of the OpenTelemetry Collector. Alloy offers native pipelines for OpenTelemetry, Prometheus, and other telemetry signals.
Grafana Alloy bundles Beyla allowing you to instrument your applications at the same time you instrument your infrastructure. It also provides a Helm chart to deploy Alloy in Kubernetes.
In this tutorial, you learn how to deploy Beyla in Kubernetes using Grafana Alloy Helm’s chart. It’s based on the examples from the Beyla and Kubernetes walkthrough.
Prerequisites
- A Kubernetes cluster, you can use kind to create a local cluster
kubectlinstalled and configured for your cluster- Helm installed
- A Grafana Cloud account or a compatible Prometheus and/or OpenTelemetry backend to receive the data
1. Prepare the Alloy environment in Kubernetes
You need to install the Helm chart for Grafana Alloy in your Kubernetes cluster.
helm install --namespace alloy alloy grafana/alloyThis command installs the Grafana Alloy Helm chart in the alloy namespace.
2. Deploy services
You can instrument any HTTP or HTTPS service in your Kubernetes cluster.
Copy the following contents into a file, for example sampleapps.yml, and deploy it with
the command kubectl apply -f sampleapps.yml.
kind: Deployment
apiVersion: apps/v1
metadata:
  name: docs
spec:
  replicas: 2
  selector:
    matchLabels:
      app: docs
  template:
    metadata:
      labels:
        app: docs
    spec:
      containers:
        - name: docs-server
          image: httpd:latest
          ports:
            - containerPort: 80
              protocol: TCP
              name: http
---
apiVersion: v1
kind: Service
metadata:
  name: docs
spec:
  selector:
    app: docs
  ports:
    - protocol: TCP
      port: 80
---
kind: Deployment
apiVersion: apps/v1
metadata:
  name: website
spec:
  replicas: 2
  selector:
    matchLabels:
      app: website
  template:
    metadata:
      labels:
        app: website
    spec:
      containers:
        - name: website-server
          image: httpd:latest
          ports:
            - containerPort: 80
              protocol: TCP
              name: http
---
apiVersion: v1
kind: Service
metadata:
  name: website
spec:
  selector:
    app: website
  ports:
    - protocol: TCP
      port: 80
3. Configure credentials
Alloy can export metrics and traces to any OpenTelemetry endpoint, as well as exposing metrics as a Prometheus endpoint. However, it’s recommend using the Prometheus and Tempo remote write endpoints in Grafana Cloud. You can get a free Grafana Cloud Account.
From the Grafana Cloud Portal, look for the Prometheus box and click Send Metrics. For the Tempo box, click Send Traces.
Create a secrets.yml file with your Grafana Cloud credentials for Prometheus and Tempo remote write. Deploy it with the command kubectl apply -f secrets.yml.
apiVersion: v1
kind: Secret
metadata:
  namespace: alloy
  name: grafana-credentials
type: Opaque
stringData:
  prometheus-rw-user: "prom-user"
  prometheus-rw-pwd: "prom-pwd"
  tempo-rw-user: "tempo-user"
  tempo-rw-pwd: "tempo-pwd"
3. Create a ConfigMap with Alloy configuration
Create a ConfigMap with the Alloy configuration. Copy the following contents into a file, for example config.alloy:
beyla.ebpf "default" {
	attributes {
		kubernetes {
			enable = "true"
		}
	}

	discovery {
		services {
			exe_path   = "http"
			open_ports = "80"
		}
	}

	output {
		traces = [otelcol.exporter.otlp.grafana_cloud_tempo.input]
	}
}

otelcol.exporter.otlp "grafana_cloud_tempo" {
	client {
		endpoint = "tempo-us-central1.grafana.net:443"
		auth     = otelcol.auth.basic.grafana_cloud_tempo.handler
	}
}

otelcol.auth.basic "grafana_cloud_tempo" {
	username = env("TEMPO_REMOTE_WRITE_USERNAME")
	password = env("TEMPO_REMOTE_WRITE_PASSWORD")
}
Deploy the configuration with the command:
kubectl create configmap --namespace alloy alloy-config "--from-file=config.alloy=./config.alloy"With this configuration Beyla instruments the services running in the Kubernetes cluster and send traces to Grafana Cloud Tempo and metrics to Prometheus.
The argument discovery > services > exe_path specifies the path to the executable of the services to instrument. The discovery > services > open_ports argument specifies the port where the services are listening.
The attributes > kubernetes > enable enables Kubernetes decoration for metrics and traces, which adds the metadata of the Kubernetes entities running the automatically instrumented services.
The prometheus.scrape section configures the Prometheus scrape configuration to collect the metrics from Beyla. The prometheus.remote_write section configures the remote write to send the metrics to Grafana Cloud Prometheus.
The output section configures that Beyla component sends traces to otelcol.exporter.otlp component. The otelcol.exporter.otlp section configures the OTLP exporter to send the traces to Grafana Cloud Tempo.
For further details on the configuration options, refer to the documentation of the Grafana Alloy Beyla component
4. Deploy Alloy with Helm
Create a values.yaml with the configuration for the Alloy Helm chart. Copy the following contents into a file, for example values.yaml.
# -- Overrides the chart's name. Used to change the infix in the resource names.
nameOverride: null

# -- Overrides the chart's computed fullname. Used to change the full prefix of
# resource names.
fullnameOverride: null

## Global properties for image pulling override the values defined under `image.registry` and `configReloader.image.registry`.
## If you want to override only one image registry, use the specific fields but if you want to override them all, use `global.image.registry`
global:
  image:
    # -- Global image registry to use if it needs to be overriden for some specific use cases (e.g local registries, custom images, ...)
    registry: ""

    # -- Optional set of global image pull secrets.
    pullSecrets: []

  # -- Security context to apply to the Grafana Alloy pod.
  podSecurityContext: {}

crds:
  # -- Whether to install CRDs for monitoring.
  create: true

## Various Alloy settings. For backwards compatibility with the grafana-agent
## chart, this field may also be called "agent". Naming this field "agent" is
## deprecated and will be removed in a future release.
alloy:
  configMap:
    # -- Create a new ConfigMap for the config file.
    create: false
    # -- Name of existing ConfigMap to use. Used when create is false.
    name: alloy-config
    # -- Key in ConfigMap to get config from.
    key: config.alloy

  clustering:
    # -- Deploy Alloy in a cluster to allow for load distribution.
    enabled: false

  # -- Minimum stability level of components and behavior to enable. Must be
  # one of "experimental", "public-preview", or "generally-available".
  stabilityLevel: "public-preview"

  # -- Path to where Grafana Alloy stores data (for example, the Write-Ahead Log).
  # By default, data is lost between reboots.
  storagePath: /tmp/alloy

  # -- Address to listen for traffic on. 0.0.0.0 exposes the UI to other
  # containers.
  listenAddr: 0.0.0.0

  # -- Port to listen for traffic on.
  listenPort: 12345

  # -- Scheme is needed for readiness probes. If enabling tls in your configs, set to "HTTPS"
  listenScheme: HTTP

  # --  Base path where the UI is exposed.
  uiPathPrefix: /

  # -- Enables sending Grafana Labs anonymous usage stats to help improve Grafana
  # Alloy.
  enableReporting: true

  # -- Extra environment variables to pass to the Alloy container.
  extraEnv:
  - name: PROMETHEUS_REMOTE_WRITE_USERNAME
    valueFrom:
      secretKeyRef:
        name: grafana-credentials
        key: prometheus-rw-user
  - name: PROMETHEUS_REMOTE_WRITE_PASSWORD
    valueFrom:
      secretKeyRef:
        name: grafana-credentials
        key: prometheus-rw-pwd
  - name: TEMPO_REMOTE_WRITE_USERNAME
    valueFrom:
      secretKeyRef:
        name: grafana-credentials
        key: tempo-rw-user
  - name: TEMPO_REMOTE_WRITE_PASSWORD
    valueFrom:
      secretKeyRef:
        name: grafana-credentials
        key: tempo-rw-pwd

  # -- Maps all the keys on a ConfigMap or Secret as environment variables. https://kubernetes.io/docs/reference/generated/kubernetes-api/v1.24/#envfromsource-v1-core
  envFrom: []

  # -- Extra args to pass to `alloy run`: https://grafana.com/docs/alloy/latest/reference/cli/run/
  extraArgs: []

  # -- Extra ports to expose on the Alloy container.
  extraPorts: []
  # - name: "faro"
  #   port: 12347
  #   targetPort: 12347
  #   protocol: "TCP"

  mounts:
    # -- Mount /var/log from the host into the container for log collection.
    varlog: false
    # -- Mount /var/lib/docker/containers from the host into the container for log
    # collection.
    dockercontainers: false

    # -- Extra volume mounts to add into the Grafana Alloy container. Does not
    # affect the watch container.
    extra: []

  # -- Security context to apply to the Grafana Alloy container.
  securityContext:
    privileged: true # important!

  # -- Resource requests and limits to apply to the Grafana Alloy container.
  resources: {}

image:
  # -- Grafana Alloy image registry (defaults to docker.io)
  registry: "docker.io"
  # -- Grafana Alloy image repository.
  repository: grafana/alloy
  # -- (string) Grafana Alloy image tag. When empty, the Chart's appVersion is
  # used.
  tag: null
  # -- Grafana Alloy image's SHA256 digest (either in format "sha256:XYZ" or "XYZ"). When set, will override `image.tag`.
  digest: null
  # -- Grafana Alloy image pull policy.
  pullPolicy: IfNotPresent
  # -- Optional set of image pull secrets.
  pullSecrets: []

rbac:
  # -- Whether to create RBAC resources for Alloy.
  create: true

serviceAccount:
  # -- Whether to create a service account for the Grafana Alloy deployment.
  create: true
  # -- Additional labels to add to the created service account.
  additionalLabels: {}
  # -- Annotations to add to the created service account.
  annotations: {}
  # -- The name of the existing service account to use when
  # serviceAccount.create is false.
  name: null

# Options for the extra controller used for config reloading.
configReloader:
  # -- Enables automatically reloading when the Alloy config changes.
  enabled: true
  image:
    # -- Config reloader image registry (defaults to docker.io)
    registry: "ghcr.io"
    # -- Repository to get config reloader image from.
    repository: jimmidyson/configmap-reload
    # -- Tag of image to use for config reloading.
    tag: v0.12.0
    # -- SHA256 digest of image to use for config reloading (either in format "sha256:XYZ" or "XYZ"). When set, will override `configReloader.image.tag`
    digest: ""
  # -- Override the args passed to the container.
  customArgs: []
  # -- Resource requests and limits to apply to the config reloader container.
  resources:
    requests:
      cpu: "1m"
      memory: "5Mi"
  # -- Security context to apply to the Grafana configReloader container.
  securityContext: {}

controller:
  # -- Type of controller to use for deploying Grafana Alloy in the cluster.
  # Must be one of 'daemonset', 'deployment', or 'statefulset'.
  type: 'daemonset'

  # -- Number of pods to deploy. Ignored when controller.type is 'daemonset'.
  replicas: 1

  # -- Annotations to add to controller.
  extraAnnotations: {}

  # -- Whether to deploy pods in parallel. Only used when controller.type is
  # 'statefulset'.
  parallelRollout: true

  # -- Configures Pods to use the host network. When set to true, the ports that will be used must be specified.
  hostNetwork: false

  # -- Configures Pods to use the host PID namespace.
  hostPID: true # important!

  # -- Configures the DNS policy for the pod. https://kubernetes.io/docs/concepts/services-networking/dns-pod-service/#pod-s-dns-policy
  dnsPolicy: ClusterFirst

  # -- Update strategy for updating deployed Pods.
  updateStrategy: {}

  # -- nodeSelector to apply to Grafana Alloy pods.
  nodeSelector: {}

  # -- Tolerations to apply to Grafana Alloy pods.
  tolerations: []

  # -- Topology Spread Constraints to apply to Grafana Alloy pods.
  topologySpreadConstraints: []

  # -- priorityClassName to apply to Grafana Alloy pods.
  priorityClassName: ''

  # -- Extra pod annotations to add.
  podAnnotations: {}

  # -- Extra pod labels to add.
  podLabels: {}

  # -- Whether to enable automatic deletion of stale PVCs due to a scale down operation, when controller.type is 'statefulset'.
  enableStatefulSetAutoDeletePVC: false

  autoscaling:
    # -- Creates a HorizontalPodAutoscaler for controller type deployment.
    enabled: false
    # -- The lower limit for the number of replicas to which the autoscaler can scale down.
    minReplicas: 1
    # -- The upper limit for the number of replicas to which the autoscaler can scale up.
    maxReplicas: 5
    # -- Average CPU utilization across all relevant pods, a percentage of the requested value of the resource for the pods. Setting `targetCPUUtilizationPercentage` to 0 will disable CPU scaling.
    targetCPUUtilizationPercentage: 0
    # -- Average Memory utilization across all relevant pods, a percentage of the requested value of the resource for the pods. Setting `targetMemoryUtilizationPercentage` to 0 will disable Memory scaling.
    targetMemoryUtilizationPercentage: 80

    scaleDown:
      # -- List of policies to determine the scale-down behavior.
      policies: []
        # - type: Pods
        #   value: 4
        #   periodSeconds: 60
      # -- Determines which of the provided scaling-down policies to apply if multiple are specified.
      selectPolicy: Max
      # -- The duration that the autoscaling mechanism should look back on to make decisions about scaling down.
      stabilizationWindowSeconds: 300

    scaleUp:
      # -- List of policies to determine the scale-up behavior.
      policies: []
        # - type: Pods
        #   value: 4
        #   periodSeconds: 60
      # -- Determines which of the provided scaling-up policies to apply if multiple are specified.
      selectPolicy: Max
      # -- The duration that the autoscaling mechanism should look back on to make decisions about scaling up.
      stabilizationWindowSeconds: 0

  # -- Affinity configuration for pods.
  affinity: {}

  volumes:
    # -- Extra volumes to add to the Grafana Alloy pod.
    extra: []

  # -- volumeClaimTemplates to add when controller.type is 'statefulset'.
  volumeClaimTemplates: []

  ## -- Additional init containers to run.
  ## ref: https://kubernetes.io/docs/concepts/workloads/pods/init-containers/
  ##
  initContainers: []

  # -- Additional containers to run alongside the Alloy container and initContainers.
  extraContainers: []

service:
  # -- Creates a Service for the controller's pods.
  enabled: true
  # -- Service type
  type: ClusterIP
  # -- NodePort port. Only takes effect when `service.type: NodePort`
  nodePort: 31128
  # -- Cluster IP, can be set to None, empty "" or an IP address
  clusterIP: ''
  # -- Value for internal traffic policy. 'Cluster' or 'Local'
  internalTrafficPolicy: Cluster
  annotations: {}
    # cloud.google.com/load-balancer-type: Internal

serviceMonitor:
  enabled: false
  # -- Additional labels for the service monitor.
  additionalLabels: {}
  # -- Scrape interval. If not set, the Prometheus default scrape interval is used.
  interval: ""
  # -- MetricRelabelConfigs to apply to samples after scraping, but before ingestion.
  # ref: https://github.com/prometheus-operator/prometheus-operator/blob/main/Documentation/api.md#relabelconfig
  metricRelabelings: []
  # - action: keep
  #   regex: 'kube_(daemonset|deployment|pod|namespace|node|statefulset).+'
  #   sourceLabels: [__name__]

  # -- Customize tls parameters for the service monitor
  tlsConfig: {}

  # -- RelabelConfigs to apply to samples before scraping
  # ref: https://github.com/prometheus-operator/prometheus-operator/blob/main/Documentation/api.md#relabelconfig
  relabelings: []
  # - sourceLabels: [__meta_kubernetes_pod_node_name]
  #   separator: ;
  #   regex: ^(.*)$
  #   targetLabel: nodename
  #   replacement: $1
  #   action: replace
ingress:
  # -- Enables ingress for Alloy (Faro port)
  enabled: false
  # For Kubernetes >= 1.18 you should specify the ingress-controller via the field ingressClassName
  # See https://kubernetes.io/blog/2020/04/02/improvements-to-the-ingress-api-in-kubernetes-1.18/#specifying-the-class-of-an-ingress
  # ingressClassName: nginx
  # Values can be templated
  annotations:
    {}
    # kubernetes.io/ingress.class: nginx
    # kubernetes.io/tls-acme: "true"
  labels: {}
  path: /
  faroPort: 12347

  # pathType is only for k8s >= 1.1=
  pathType: Prefix

  hosts:
    - chart-example.local
  ## Extra paths to prepend to every host configuration. This is useful when working with annotation based services.
  extraPaths: []
  # - path: /*
  #   backend:
  #     serviceName: ssl-redirect
  #     servicePort: use-annotation
  ## Or for k8s > 1.19
  # - path: /*
  #   pathType: Prefix
  #   backend:
  #     service:
  #       name: ssl-redirect
  #       port:
  #         name: use-annotation

  tls: []
  #  - secretName: chart-example-tls
  #    hosts:
  #      - chart-example.local
Deploy the configuration with the command:
helm upgrade --namespace alloy alloy grafana/alloy -f values.yaml- To run in DaemonSet mode, Beyla requires to have access to all the
processes in the node. Therefore set
hostPID: truethecontrollersection. - The Beyla container needs to run with privileges as it requires
to perform privileged actions such as loading BPF programs and creating
BPF maps. Therefore set
privileged: trueinsecurityContextsection. For running Beyla asunprivilegedcontainer, that’s without theprivileged: trueoption, visit the Deploy Beyla unprivileged guide. - The
extraEnvsection sets the environment variables for the Prometheus and Tempo remote write credentials.
5. Test the setup
With the kubectl port-forward commands from the first step still running,
test both web server instances. For example:
curl http://localhost:8080
curl http://localhost:8080/foo
curl http://localhost:8081
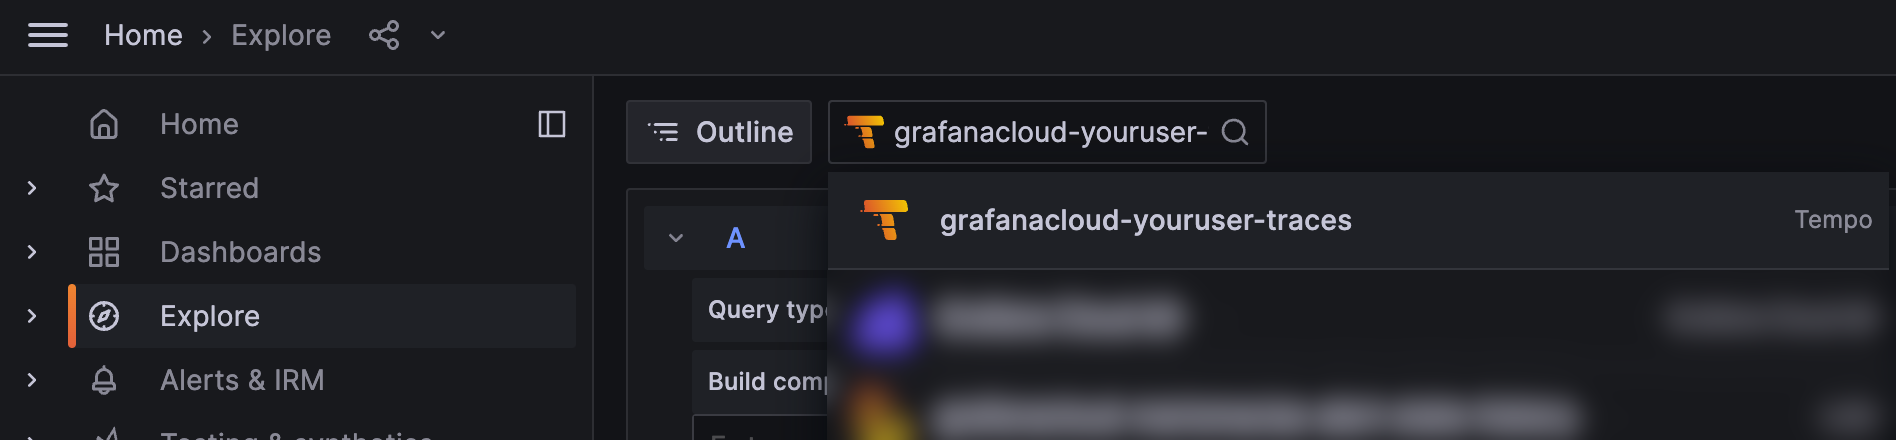
curl http://localhost:8081/fooNavigate to the instance in Grafana Cloud, and from the Explore section in the left panel, select the data source for the traces, named grafanacloud-<your user name>-traces.
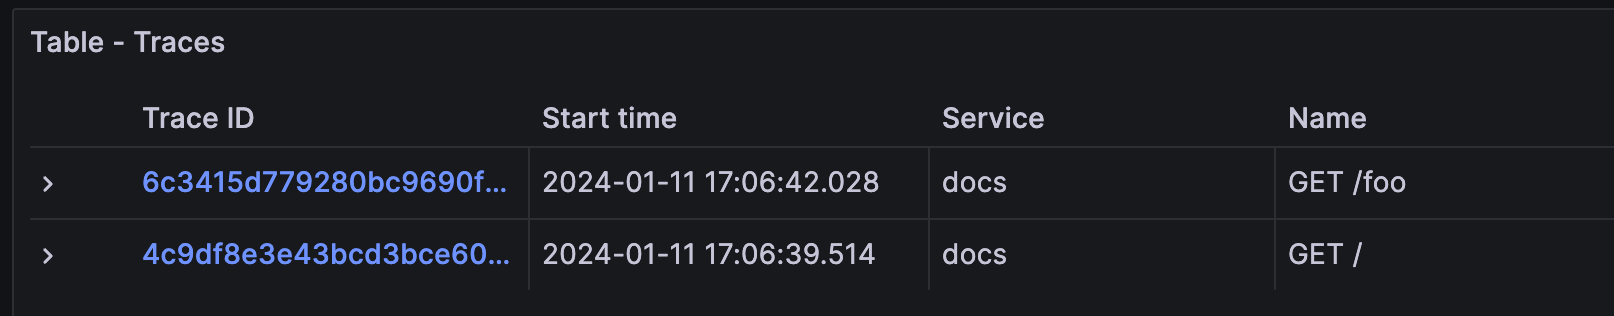
To search for all the traces, select the Search box in the Query bar, leave the form empty, and click Run query:
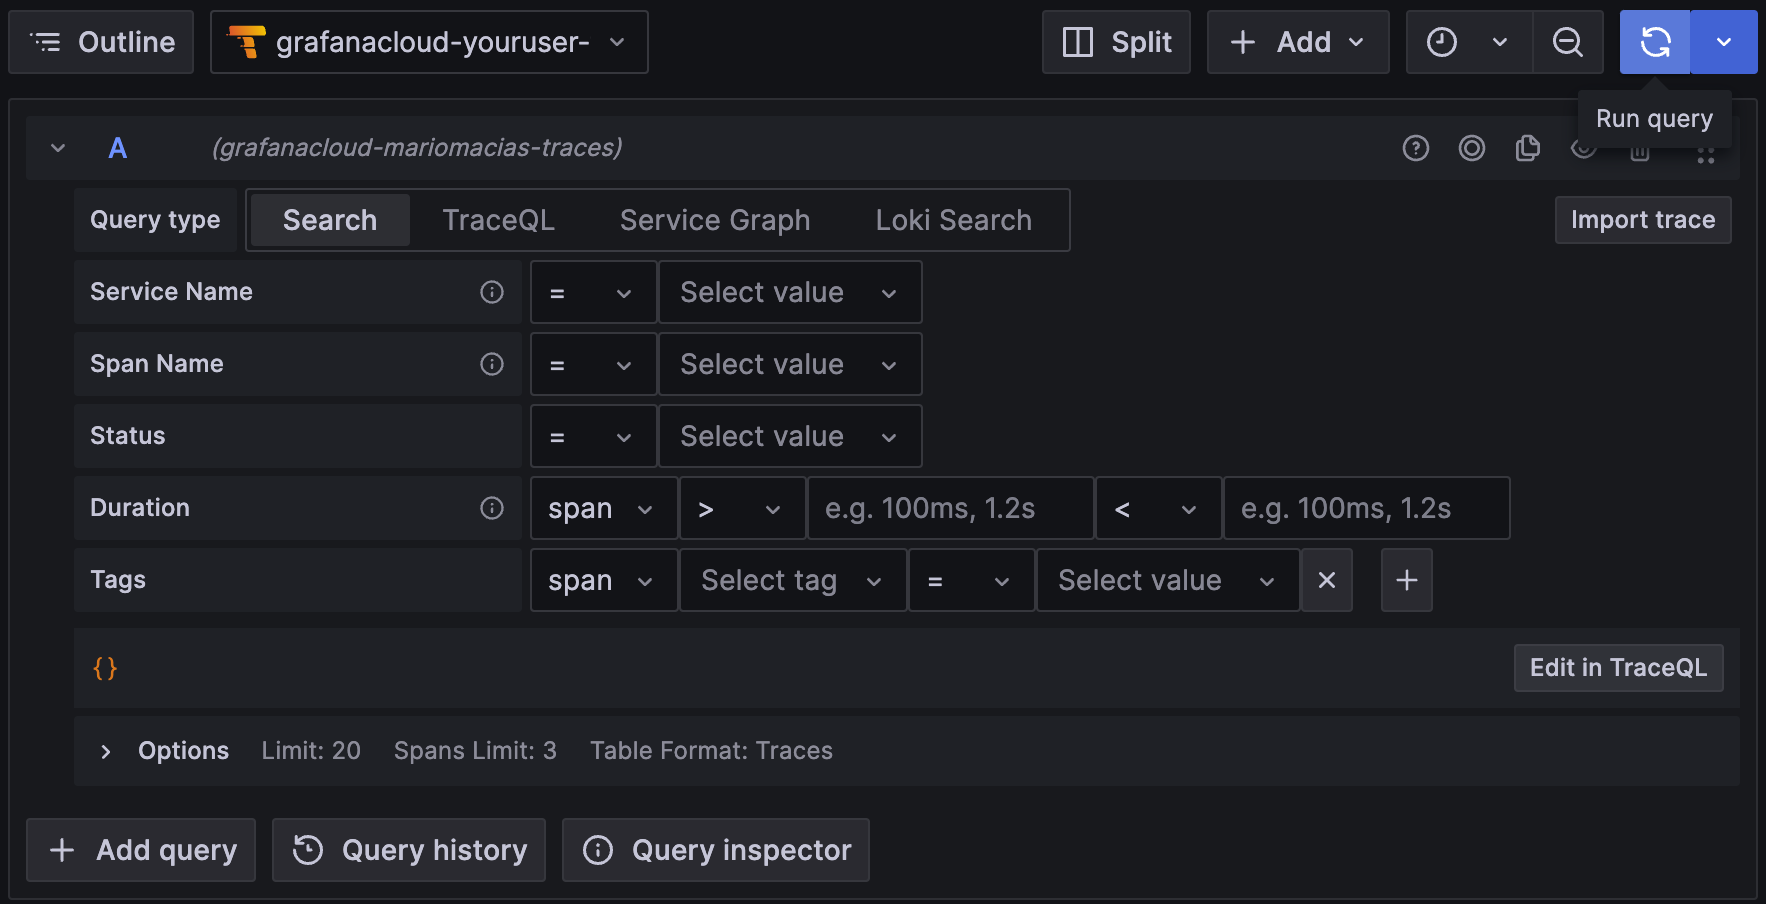
This shows the traces for the docs instance on port 8081. You might see traces from your own services, but you shouldn’t see traces from the website service, as it Beyla isn’t instrumenting it.
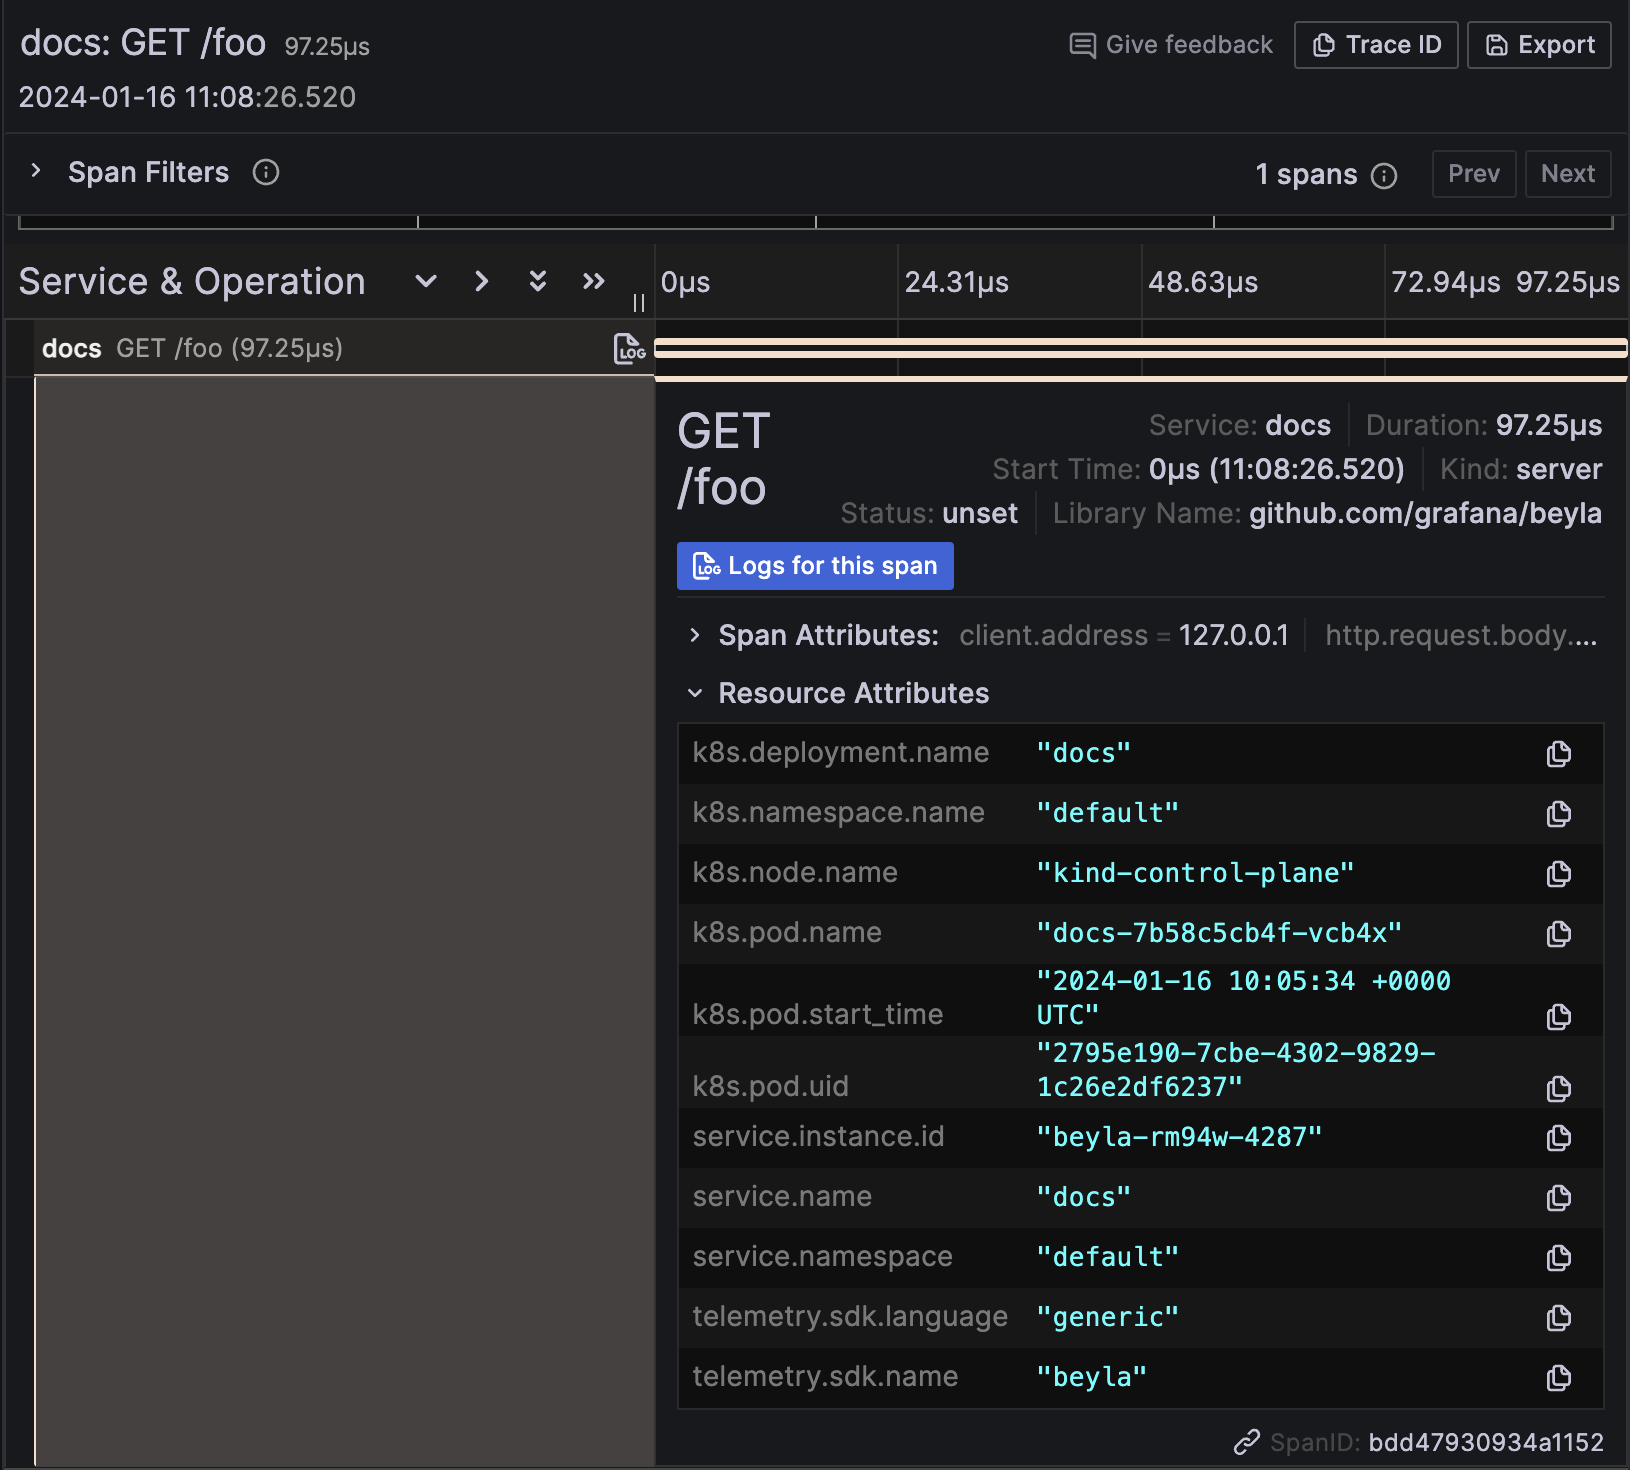
In the trace details, the resource attributes of the traces have metadata of the Kubernetes Pod running the instrumented service:
Was this page helpful?
Related resources from Grafana Labs