Debug Grafana Alloy
Follow these steps to debug issues with Alloy:
- Use the Alloy UI to debug issues.
- If the Alloy UI doesn’t help with debugging an issue, you can examine the logs.
Alloy UI
Alloy includes an embedded UI viewable from the Alloy HTTP server, which defaults to listening at http://localhost:12345.
Note
For security reasons, installations of Alloy on non-containerized platforms default to listening on
localhost. This default prevents other machines on the network from being able to view the UI.To expose the UI to other machines on the network on non-containerized platforms, refer to the documentation for how you installed Alloy.
If you are running a custom installation of Alloy, refer to the documentation for the
runcommand to learn how to change the HTTP listen address and pass the appropriate flag when running Alloy.
Home page
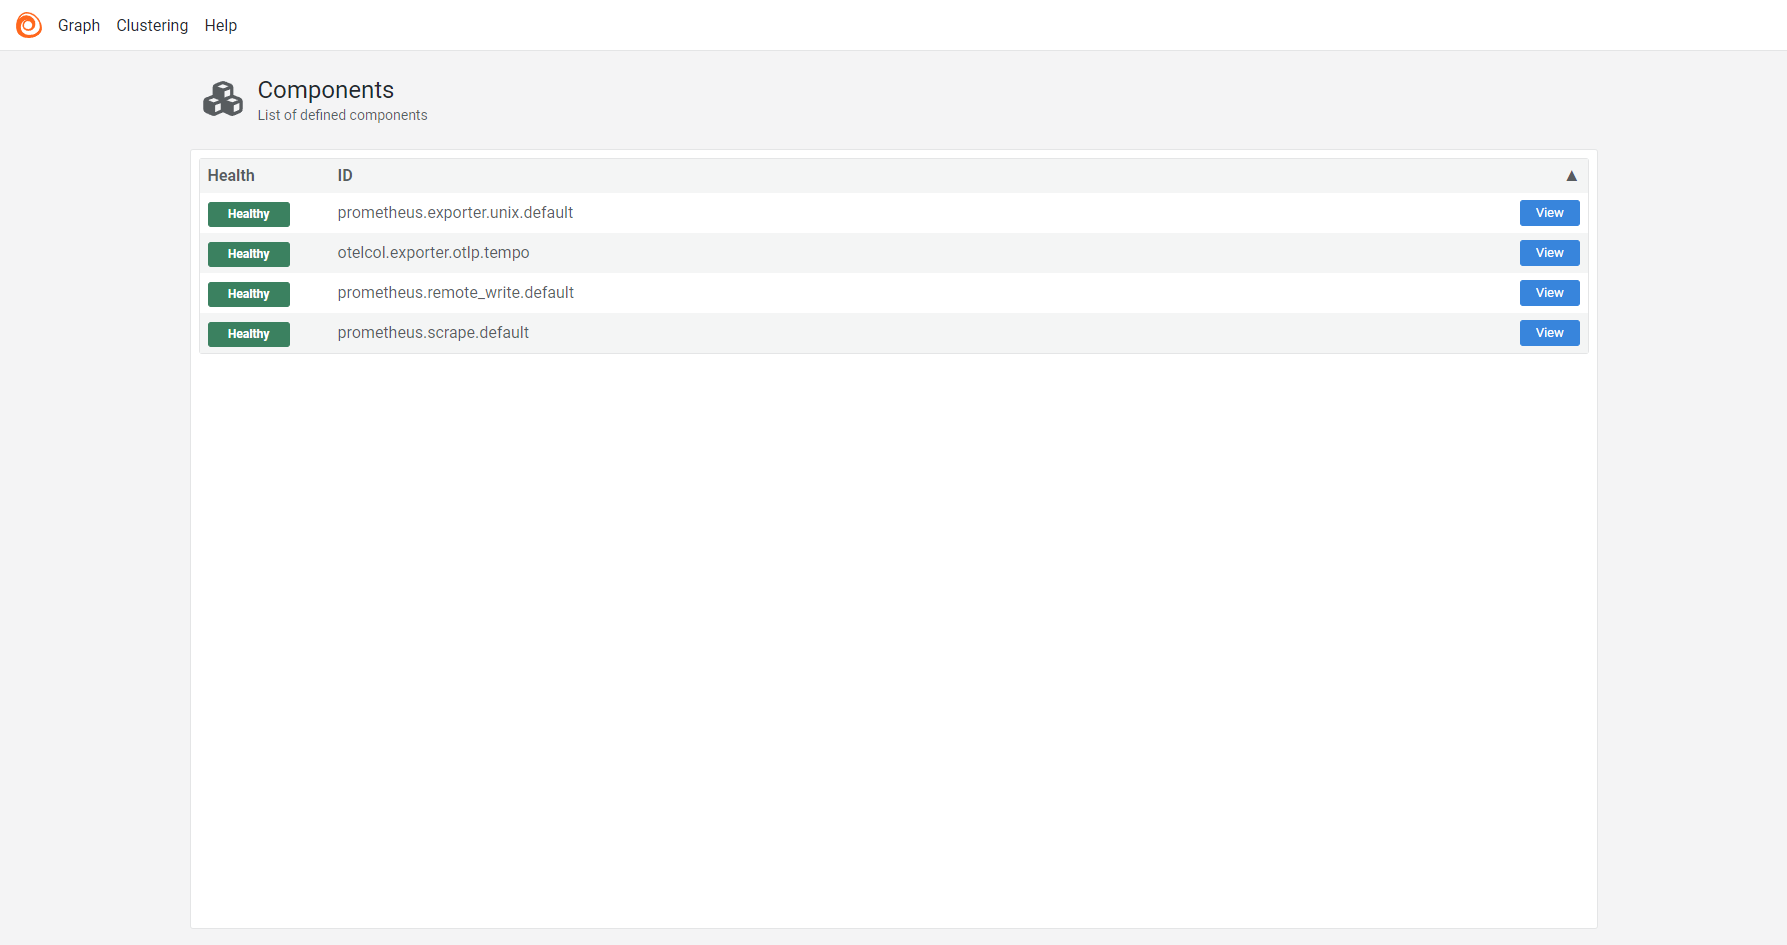
The home page shows a table of components defined in the configuration file and their health.
Click View on a row in the table to navigate to the Component detail page for that component.
Click the Alloy logo to navigate back to the home page.
Graph page
EXPERIMENTAL: This is an experimental feature. Experimental features are subject to frequent breaking changes, and may be removed with no equivalent replacement. To enable and use an experimental feature, you must set the
stability.levelflag toexperimental.
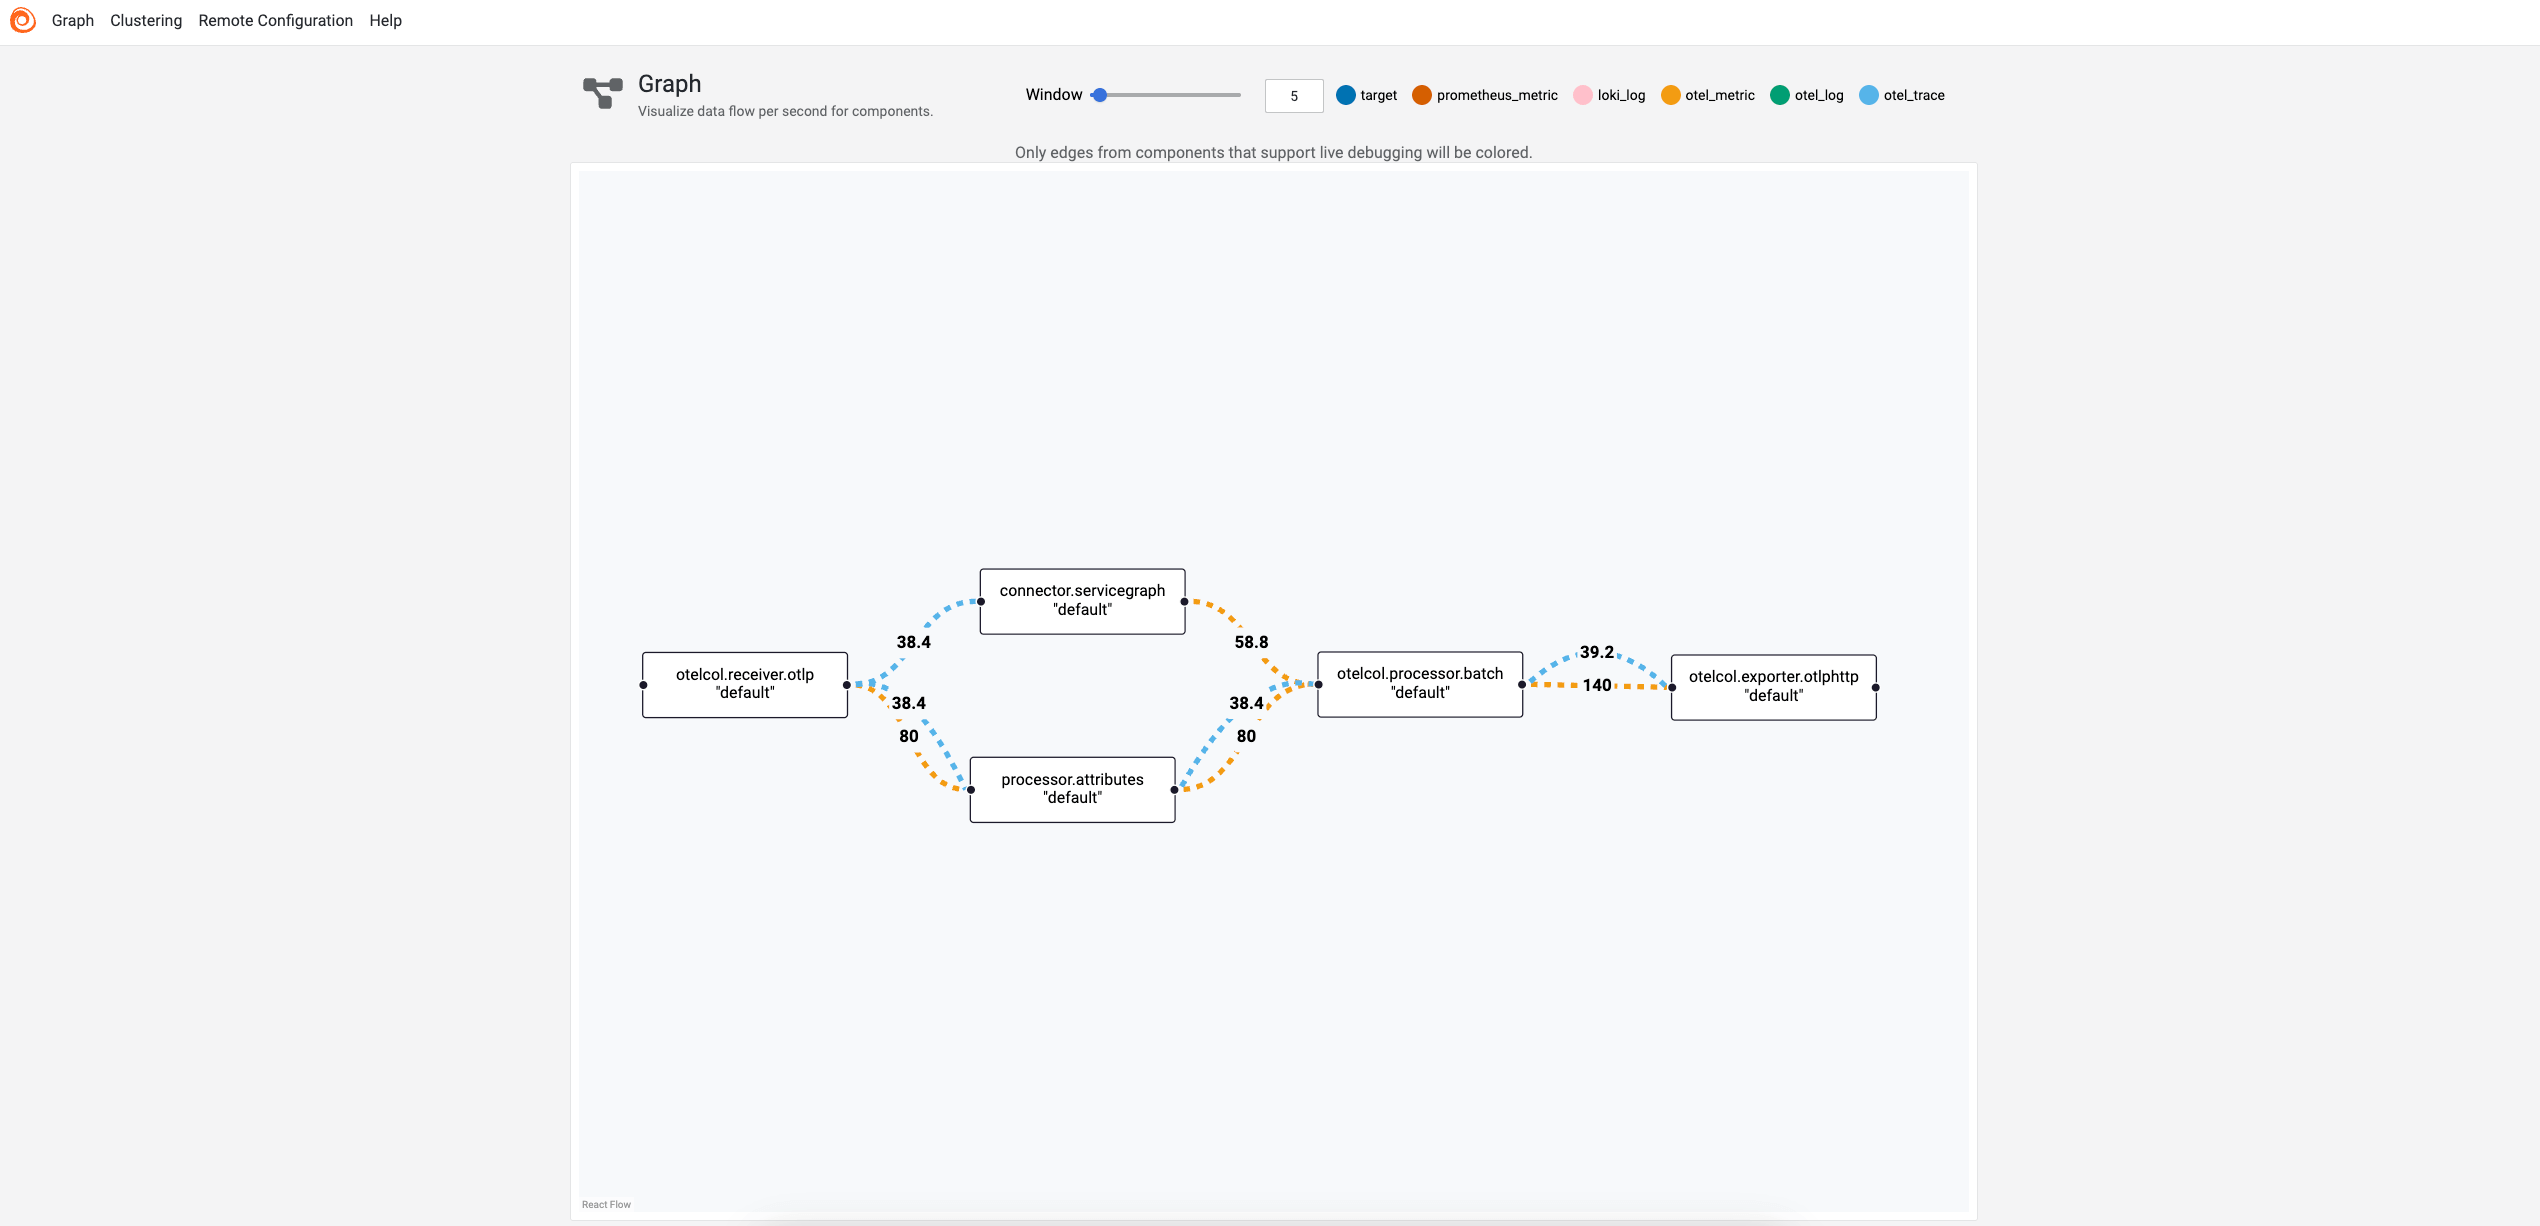
The Graph page shows a graph view of components defined in the configuration file. Clicking a component in the graph navigates to the Component detail page for that component.
You can click and drag the components to move them around.
To access the graph page of a module, click on the Graph button on the module’s detail page.
The amount of data that exits a component that supports live debugging is shown on the outgoing edges of the component.
The data is refreshed according to the window parameter.
Component detail page
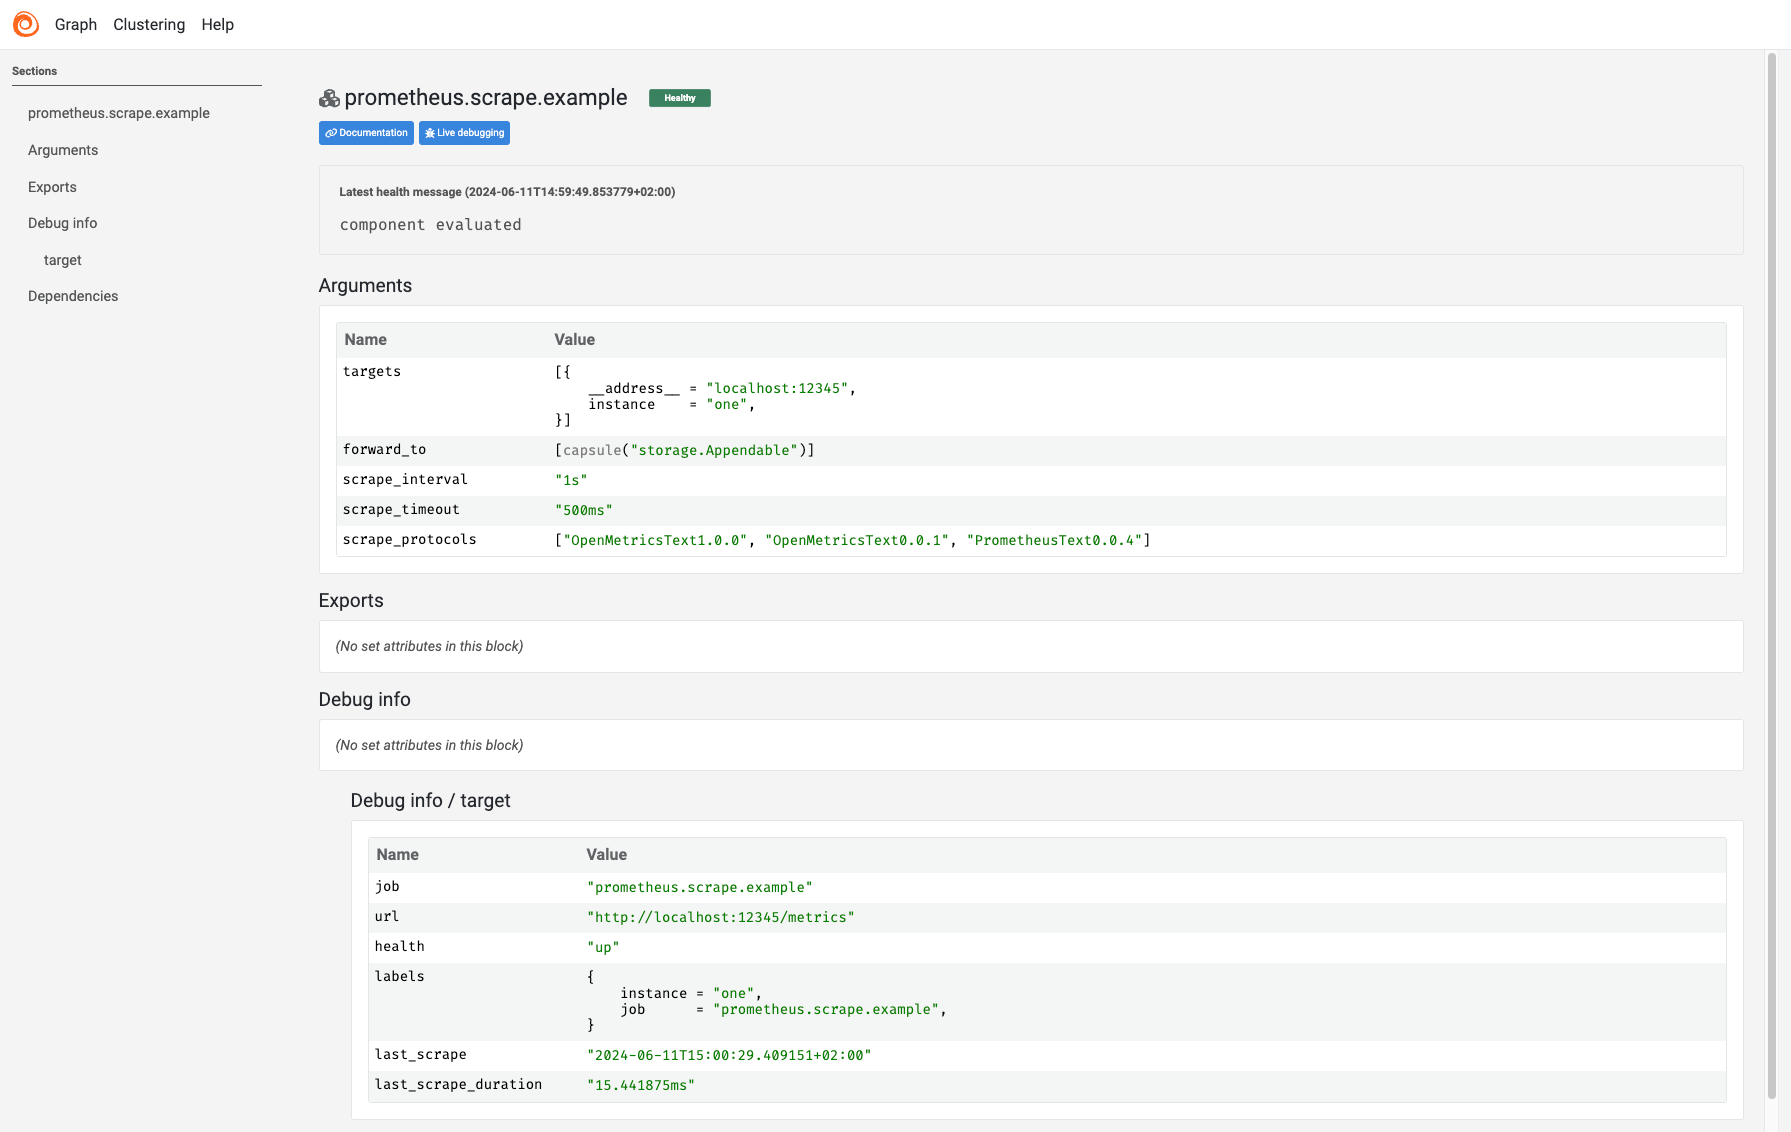
The component detail page shows the following information for each component:
- The health of the component with a message explaining the health.
- The current evaluated arguments for the component.
- The current exports for the component.
- The current debug info for the component if the component has debug info.
From there you can also go to the component documentation or to its corresponding Live Debugging page.
Note
Values marked as a secret display only as the text
(secret).
Clustering page
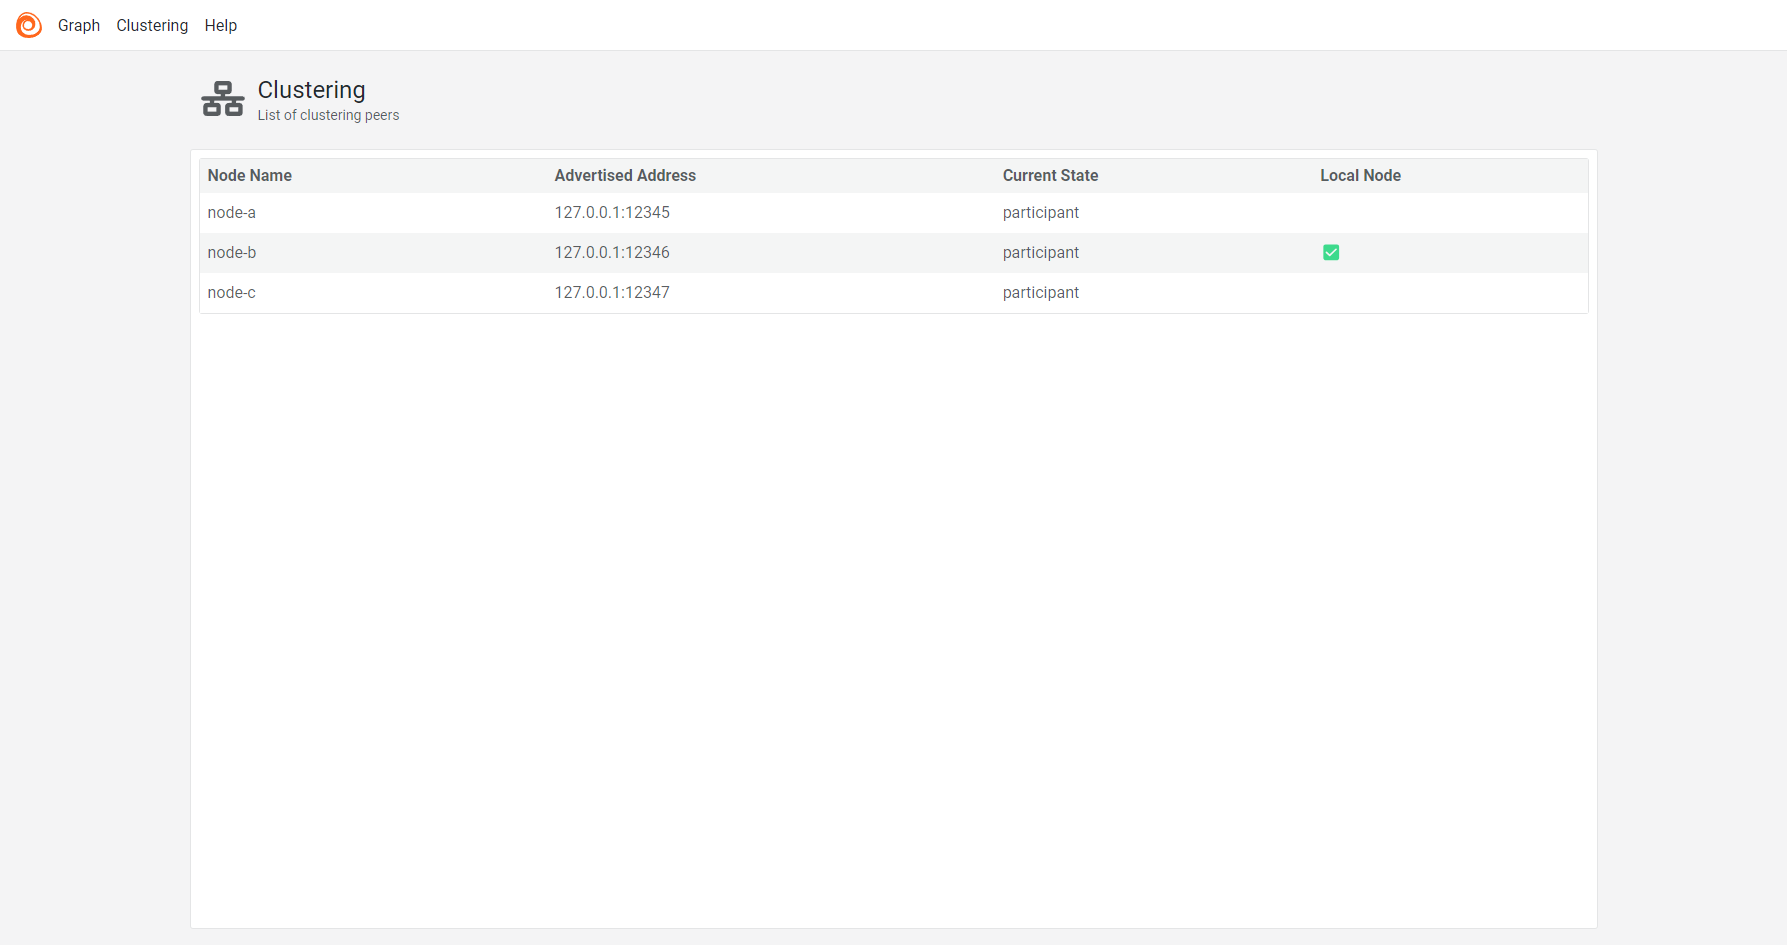
The clustering page shows the following information for each cluster node:
- The node’s name.
- The node’s advertised address.
- The node’s current state: Viewer, Participant, or Terminating.
- The local node that serves the UI.
Live Debugging page
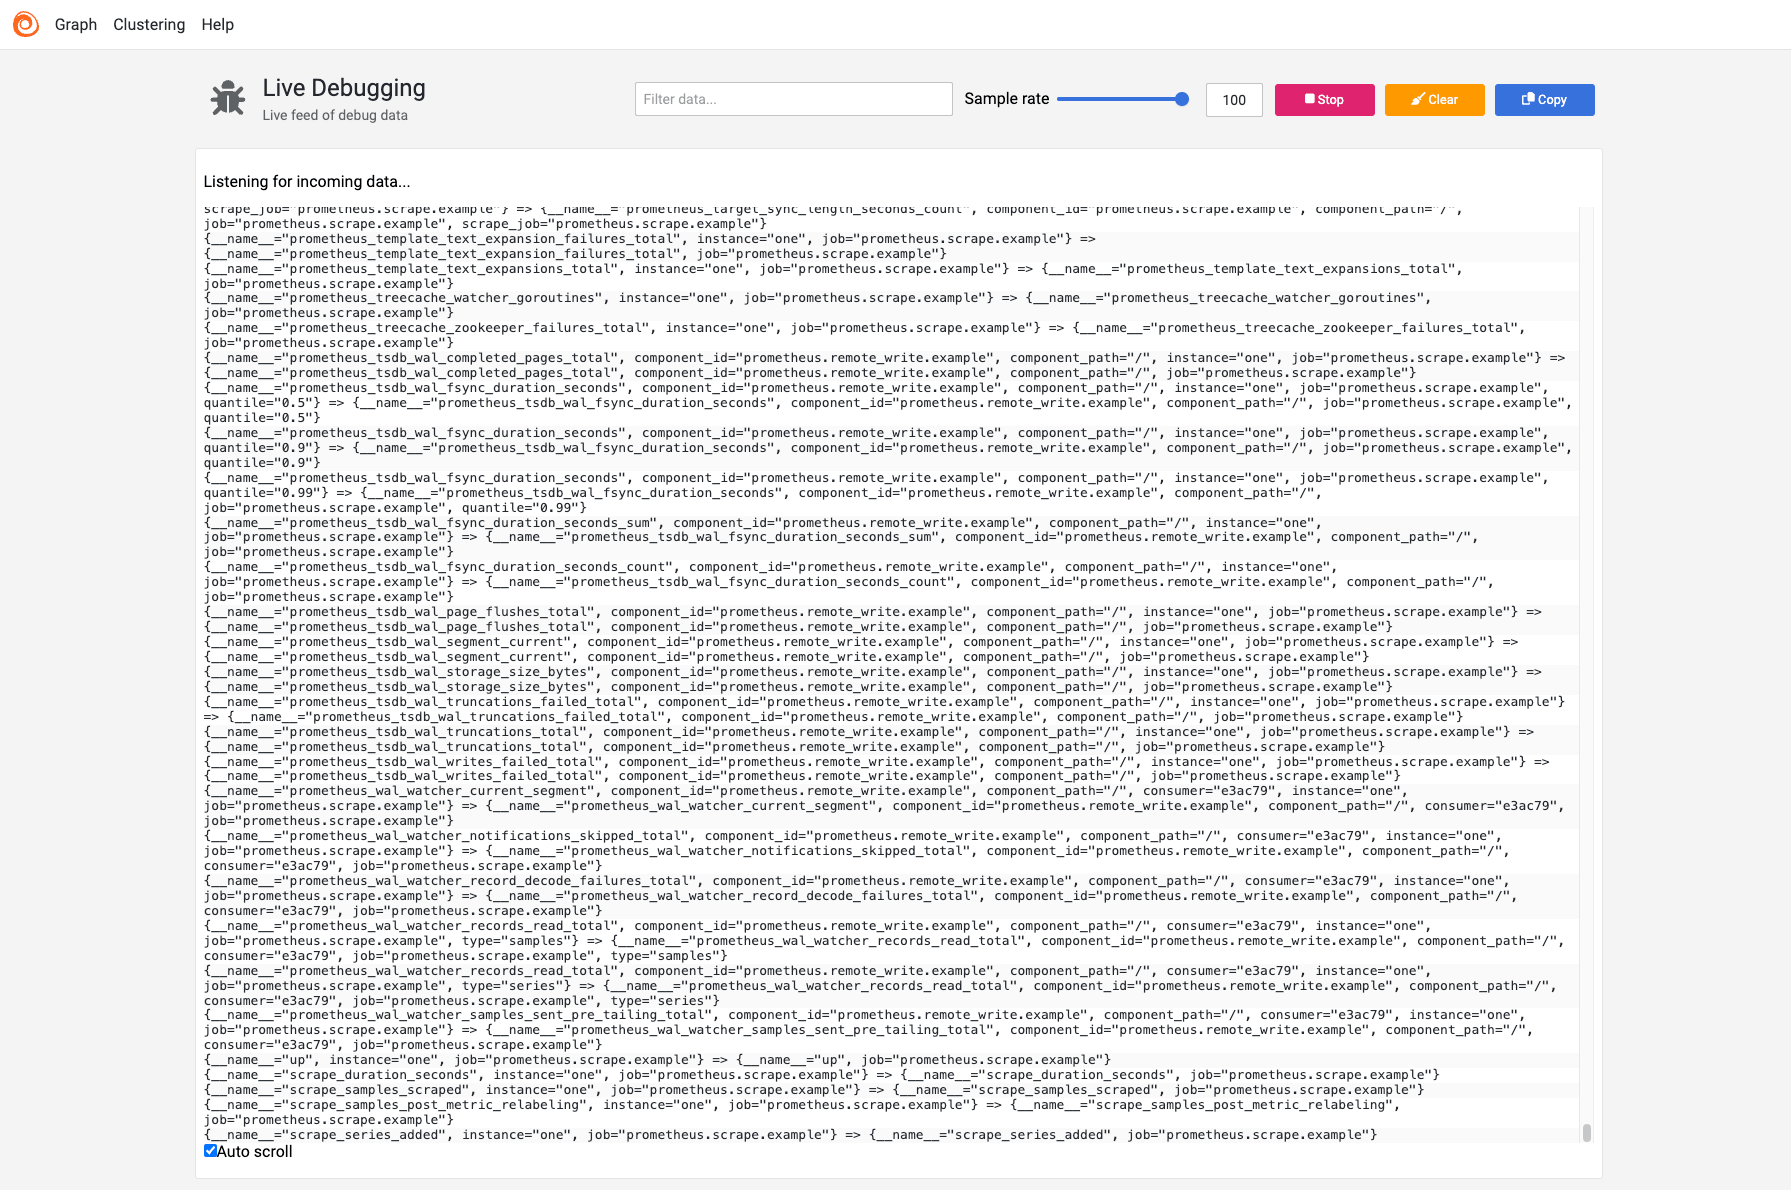
Live debugging provides a real-time stream of debugging data from a component. You can access this page from the corresponding Component detail page.
Caution
Live debugging defaults to disabled to avoid accidentally displaying sensitive telemetry data. To enable live debugging, configure the
livedebuggingblock.
Live debugging allows you to do the following:
- Pause and clear the data stream.
- Sample data and disable auto-scrolling to handle heavy loads.
- Search through the data using keywords.
- Copy the entire data stream to the clipboard.
The format and content of the debugging data vary depending on the component type.
Note
Live debugging isn’t yet available in all components.
Supported components:
loki.processloki.relabelloki.secretfilterotelcol.connector.*otelcol.processor.*otelcol.receiver.*prometheus.remote_writeprometheus.relabeldiscovery.*prometheus.scrape
Debug using the UI
To debug using the UI:
- Ensure that no component reports as unhealthy.
- Ensure that the arguments and exports for misbehaving components appear correct.
- Ensure that the live debugging data meets your expectations.
Examine logs
Alloy provides different log levels that help you determine the root cause of issues.
You can configure the log level using the logging configuration block in your Alloy configuration file.
Logs from Alloy are written in logfmt format by default.
You can configure the log format to be either logfmt or json.
You can retrieve the logs in different ways depending on your platform and installation method.
Common log messages
The following log messages are normal during Alloy operation:
Component lifecycle messages
During normal startup and operation, you’ll see messages about component lifecycle:
Component startup and initialization:
level=info msg="starting controller"
level=info msg="starting server"
level=info msg="starting server" addr=localhost:8080
level=info msg="started scheduled components"
Note
The
starting servermessages refer to the built-in HTTP server that hosts the debugging UI,/metricsendpoint, and other debugging endpoints.
Component updates and configuration changes:
level=info msg="configuration loaded"
level=info msg="module content loaded"
level=info msg="started scheduled components"
level=info msg="terminating server"
Component health reporting:
level=info msg="started scheduled components"
level=warn msg="failed to start scheduled component" err="connection refused"
level=warn msg="the discovery.process component only works on linux; enabling it otherwise will do nothing"
Cluster operation messages
If you enable clustering, you’ll see messages about cluster operations:
Normal startup and peer discovery:
level=info msg="starting cluster node" peers_count=2 peers=192.168.1.10:12345,192.168.1.11:12345 advertise_addr=192.168.1.12:12345
level=info msg="using provided peers for discovery" join_peers="192.168.1.10:12345, 192.168.1.11:12345"
level=info msg="discovered peers" peers_count=3 peers=192.168.1.10:12345,192.168.1.11:12345,192.168.1.12:12345
level=info msg="rejoining peers" peers_count=2 peers=192.168.1.10:12345,192.168.1.11:12345
Cluster size management:
level=info msg="minimum cluster size reached, marking cluster as ready to admit traffic" minimum_cluster_size=3 peers_count=3
level=warn msg="minimum cluster size requirements are not met - marking cluster as not ready for traffic" minimum_cluster_size=3 minimum_size_wait_timeout=5m0s peers_count=2
level=warn msg="deadline passed, marking cluster as ready to admit traffic" minimum_cluster_size=3 minimum_size_wait_timeout=5m0s peers_count=2
Normal cluster operations:
level=debug msg="found an IP cluster join address" addr=192.168.1.10:12345
level=debug msg="received DNS query response" addr=cluster.example.com record_type=A records_count=3
Expected warnings
Some warnings are normal during startup or cluster changes:
level=warn msg="failed to get peers to join at startup; will create a new cluster" err="no peers available"
level=warn msg="failed to connect to peers; bootstrapping a new cluster" err="connection refused"
level=warn msg="failed to resolve provided join address" addr=unavailable-node:12345
Problematic messages
These messages indicate issues that require attention:
level=error msg="failed to bootstrap a fresh cluster with no peers" err="bind: address already in use"
level=error msg="failed to rejoin list of peers" err="connection timeout"
level=warn msg="failed to refresh list of peers" err="dns resolution failed"
Debug clustering issues
To debug issues when using clustering, check for the following symptoms.
- Cluster not converging: The cluster peers aren’t converging on the same view of their peers’ status. This is most likely due to network connectivity issues between the cluster nodes. Use the Alloy UI of each running peer to understand which nodes aren’t picked up correctly.
- Cluster split brain: The cluster peers aren’t aware of one another, thinking they’re the only node present. Again, check for network connectivity issues. Check that the addresses or DNS names given to the node to join are correctly formatted and reachable.
- Configuration drift: Clustering assumes that all nodes are running with the same configuration file at roughly the same time. Check the logs for issues with the reloaded configuration file as well as the graph page to verify that the changes are applied.
- Node name conflicts: Clustering assumes all nodes have unique names. The cluster rejects nodes with conflicting names and they won’t join the cluster. Look at the clustering UI page for the list of current peers with their names, and check the logs for any reported name conflict events.
- Node stuck in terminating state: The node attempted to gracefully shut down and set its state to Terminating, but it hasn’t completely gone away. Check the clustering page to view the state of the peers and verify that the terminating Alloy has been shut down.
Note
Some issues that appear to be clustering issues may be symptoms of other issues, for example, problems with scraping or service discovery can result in missing metrics for an Alloy instance that you can interpret as a node not joining the cluster.


