
Caution
Grafana Alloy is the new name for our distribution of the OTel collector. Grafana Agent has been deprecated and is in Long-Term Support (LTS) through October 31, 2025. Grafana Agent will reach an End-of-Life (EOL) on November 1, 2025. Read more about why we recommend migrating to Grafana Alloy.
Important: This documentation is about an older version. It's relevant only to the release noted, many of the features and functions have been updated or replaced. Please view the current version.
Deploy Grafana Agent
Grafana Agent is a flexible, vendor-neutral telemetry collector. This flexibility means that Grafana Agent doesn’t enforce a specific deployment topology but can work in multiple scenarios.
This page lists common topologies used for deployments of Grafana Agent, when to consider using each topology, issues you may run into, and scaling considerations.
As a centralized collection service
Deploying Grafana Agent as a centralized service is recommended for collecting application telemetry. This topology allows you to use a smaller number of agents to coordinate service discovery, collection, and remote writing.
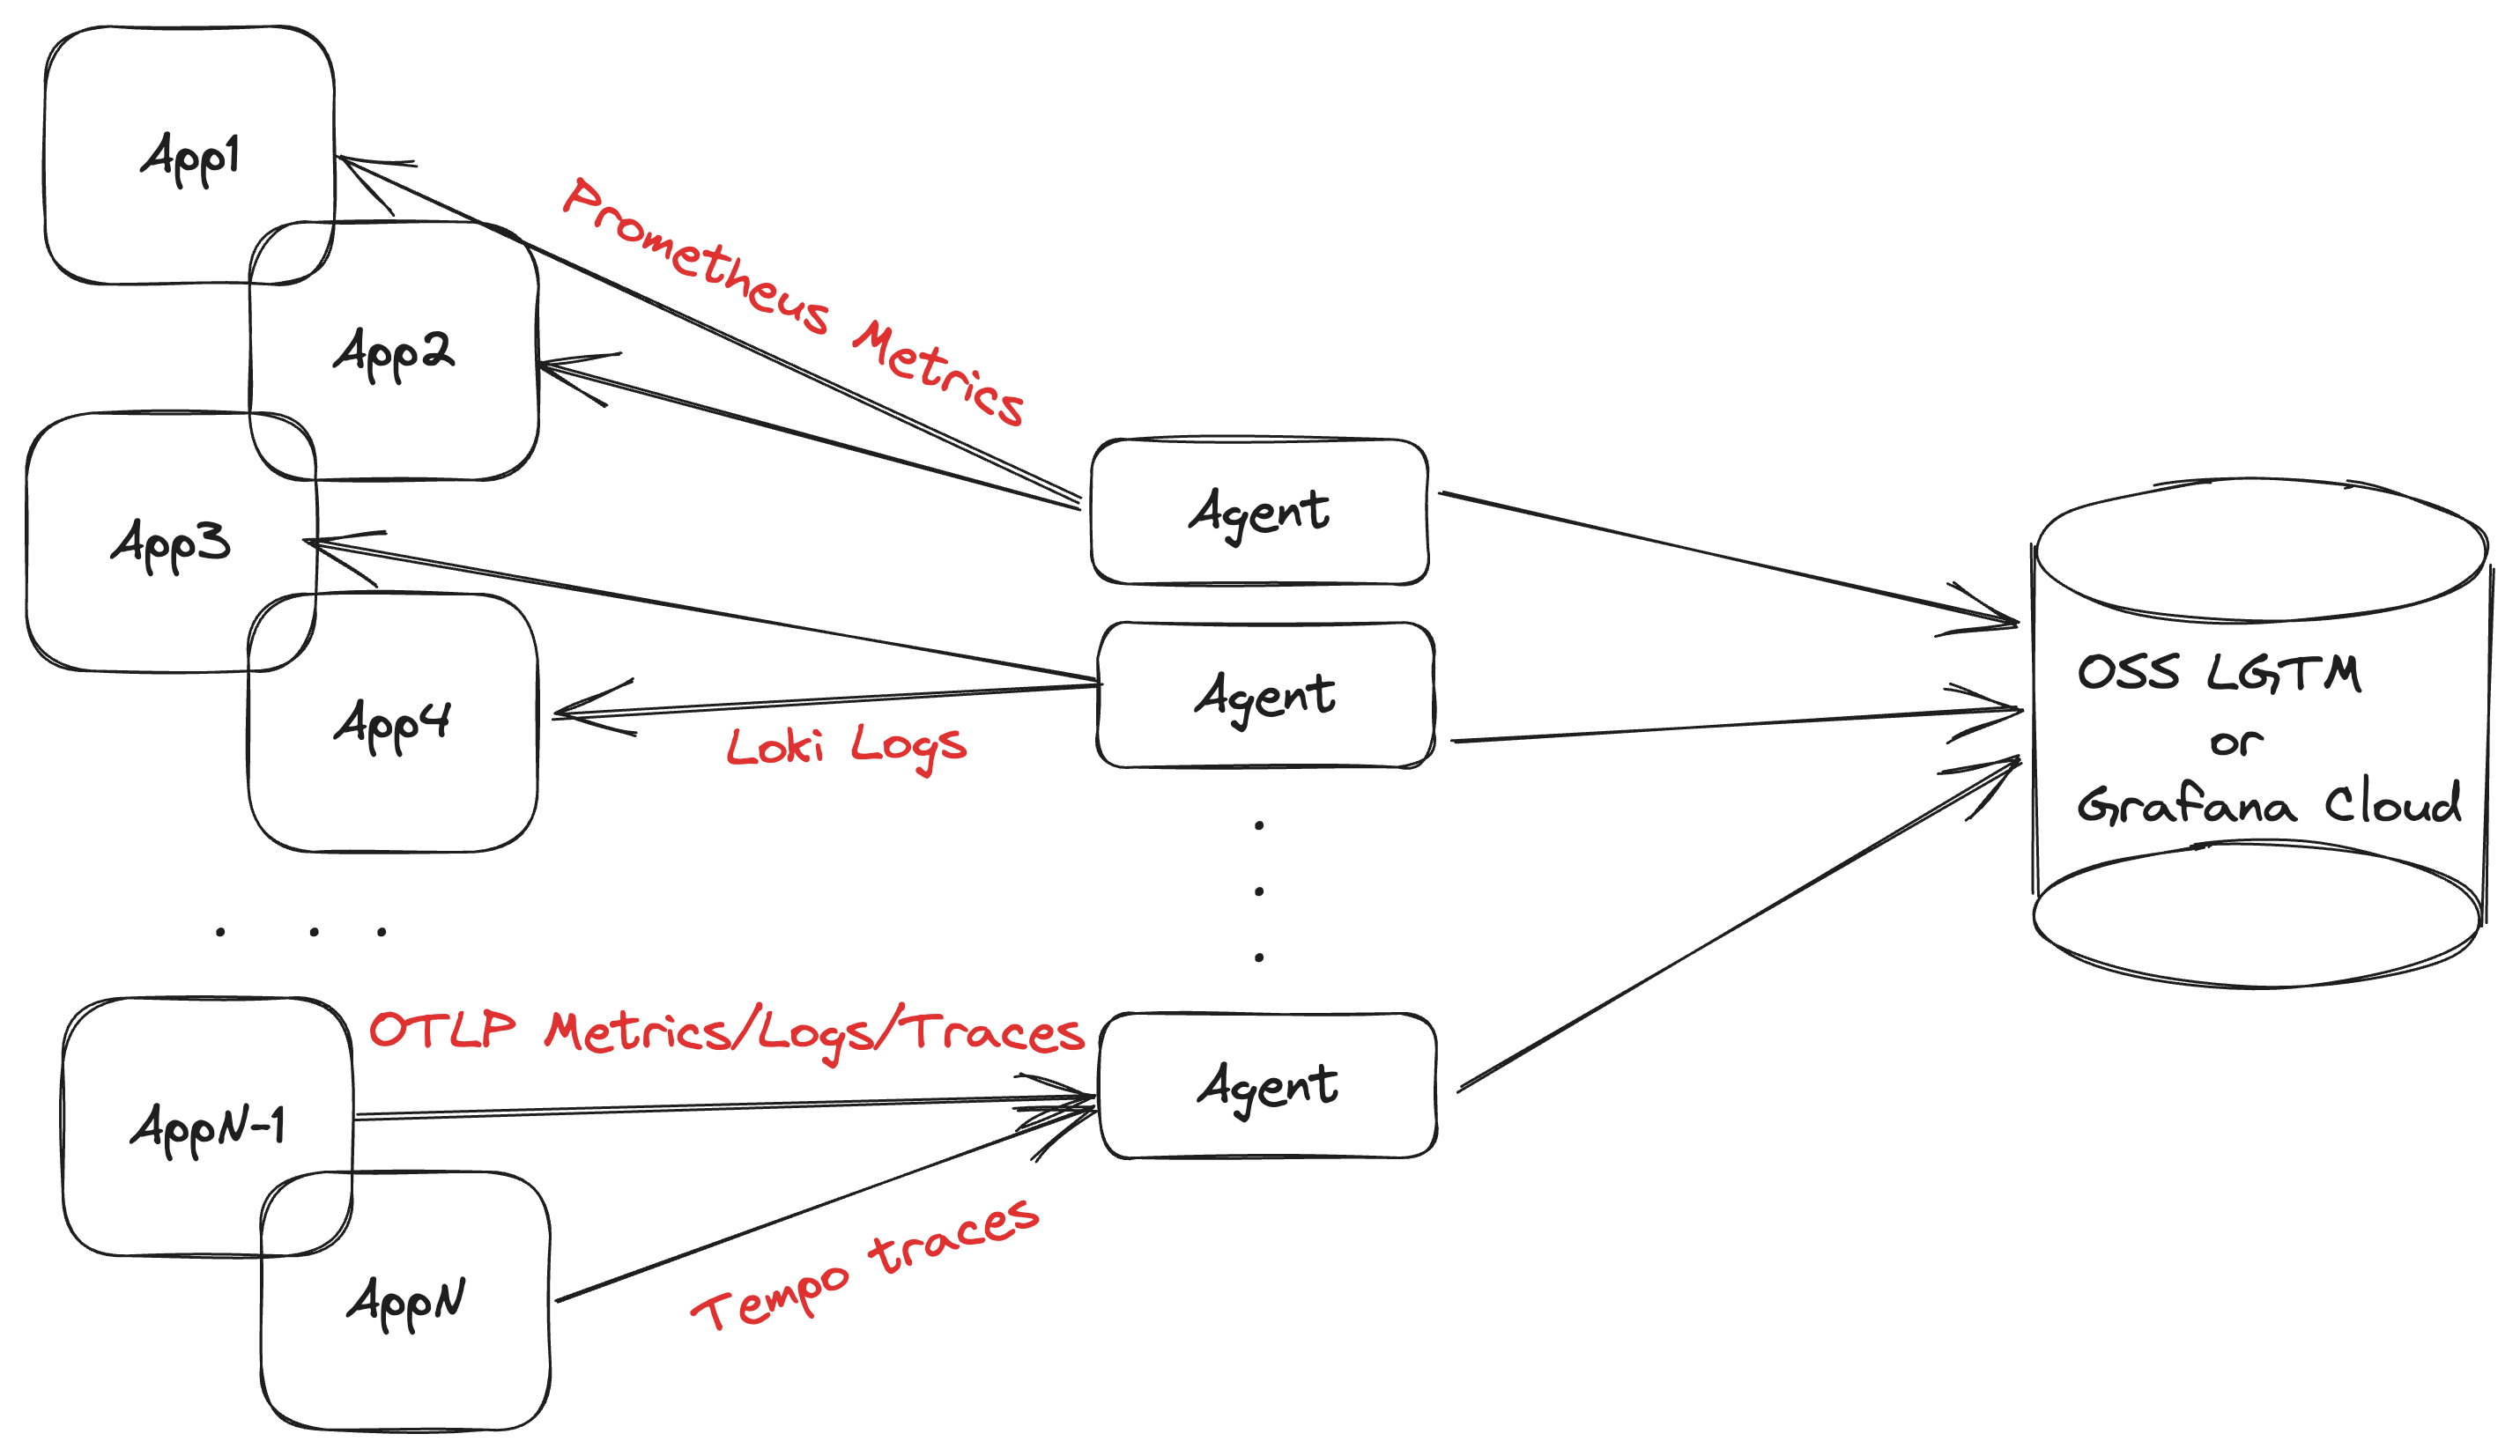
Using this topology requires deploying the Agent on separate infrastructure, and making sure that agents can discover and reach these applications over the network. The main predictor for the size of the agent is the number of active metrics series it is scraping; a rule of thumb is approximately 10 KB of memory for each series. We recommend you start looking towards horizontal scaling around the 1 million active series mark.
Using Kubernetes StatefulSets
Deploying Grafana Agent as a StatefulSet is the recommended option for metrics collection. The persistent pod identifiers make it possible to consistently match volumes with pods so that you can use them for the WAL directory.
You can also use a Kubernetes deployment in cases where persistent storage is not required, such as a traces-only pipeline.
Pros
- Straightforward scaling using clustering or hashmod sharding
- Minimizes the “noisy neighbor” effect
- Easy to meta-monitor
Cons
- Requires running on separate infrastructure
Use for
- Scalable telemetry collection
Don’t use for
- Host-level metrics and logs
As a host daemon
Deploying one Grafana Agent per machine is required for collecting machine-level metrics and logs, such as node_exporter hardware and network metrics or journald system logs.
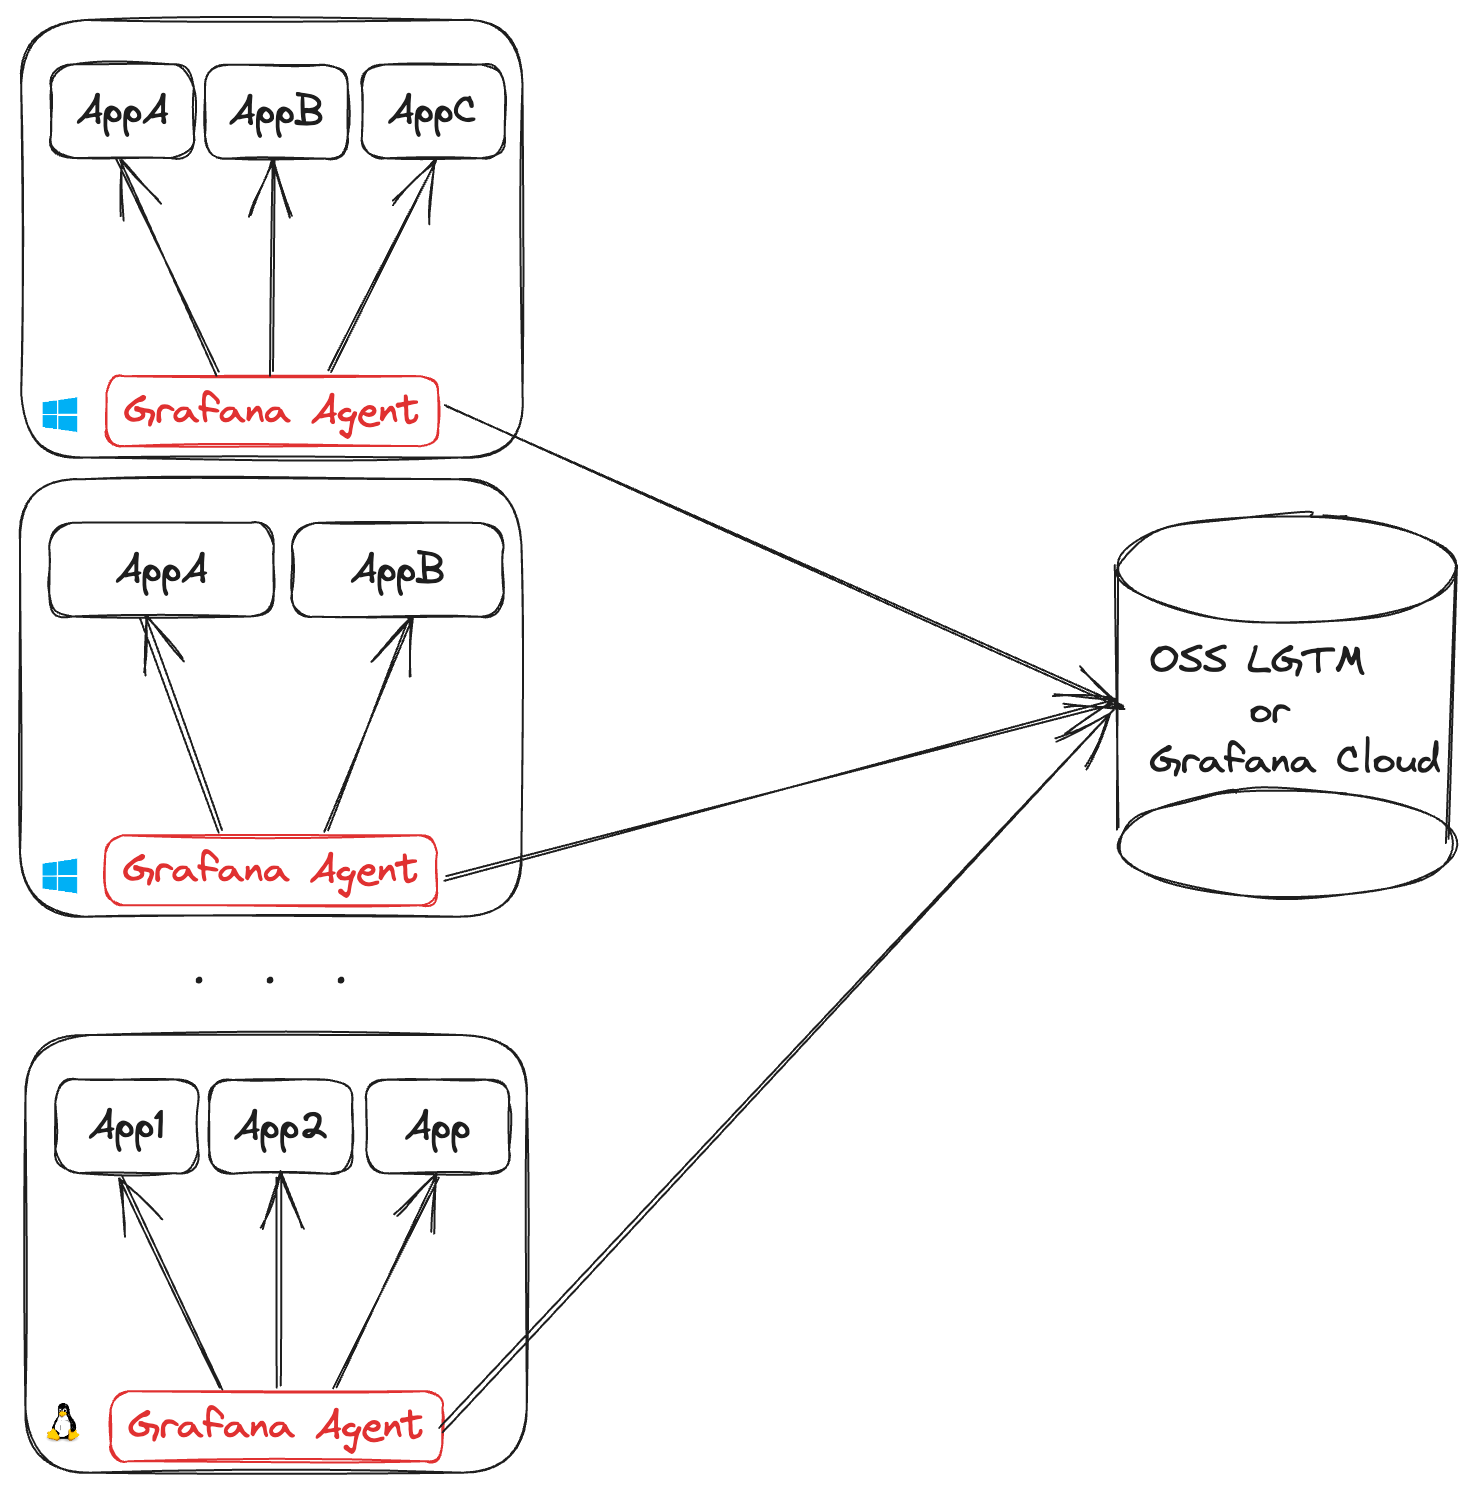
Each Grafana Agent requires you to open an outgoing connection for each remote endpoint it’s shipping data to. This can lead to NAT port exhaustion on the egress infrastructure. Each egress IP can support up to (65535 - 1024 = 64511) outgoing connections on different ports. So, if all agents are shipping metrics and log data, an egress IP can support up to 32,255 agents.
Using Kubernetes DaemonSets
The simplest use case of the host daemon topology is a Kubernetes DaemonSet, and it is required for node-level observability (for example cAdvisor metrics) and collecting pod logs.
Pros
- Doesn’t require running on separate infrastructure
- Typically leads to smaller-sized agents
- Lower network latency to instrumented applications
Cons
- Requires planning a process for provisioning Grafana Agent on new machines, as well as keeping configuration up to date to avoid configuration drift
- Not possible to scale agents independently when using Kubernetes DaemonSets
- Scaling the topology can strain external APIs (like service discovery) and network infrastructure (like firewalls, proxy servers, and egress points)
Use for
- Collecting machine-level metrics and logs (for example, node_exporter hardware metrics, Kubernetes pod logs)
Don’t use for
- Scenarios where Grafana Agent grows so large it can become a noisy neighbor
- Collecting an unpredictable amount of telemetry
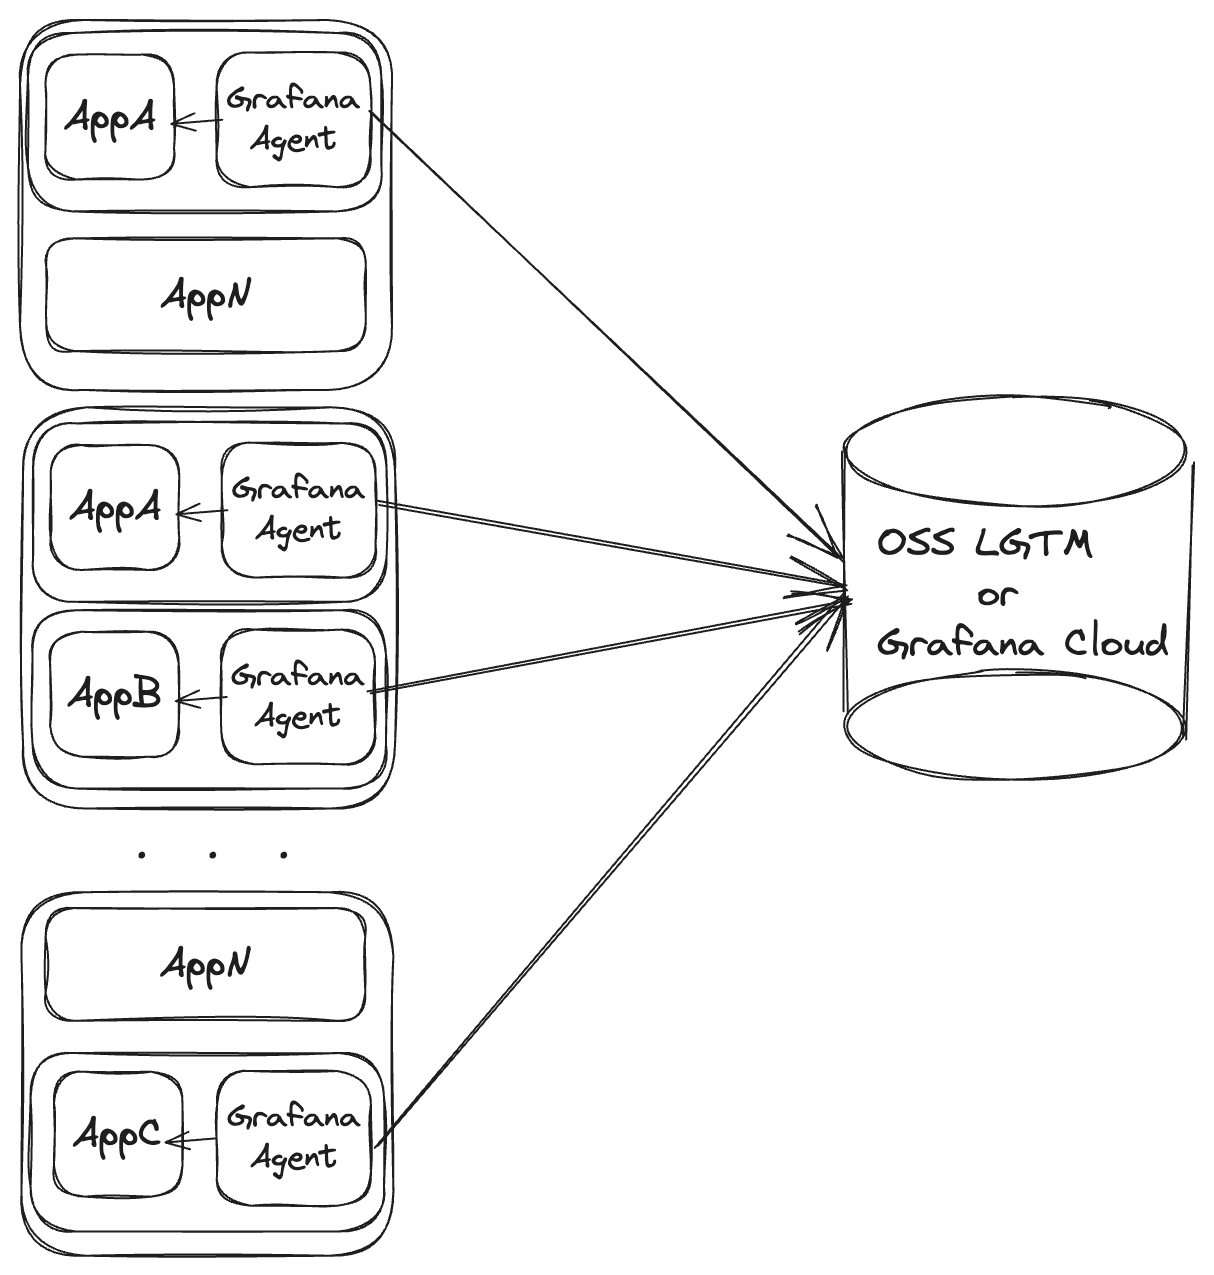
As a container sidecar
Deploying Grafana Agent as a container sidecar is only recommended for short-lived applications or specialized agent deployments.
Using Kubernetes pod sidecars
In a Kubernetes environment, the sidecar model consists of deploying Grafana Agent as an extra container on the pod. The pod’s controller, network configuration, enabled capabilities, and available resources are shared between the actual application and the sidecar agent.
Pros
- Doesn’t require running on separate infrastructure
- Straightforward networking with partner applications
Cons
- Doesn’t scale separately
- Makes resource consumption harder to monitor and predict
- Agents do not have a life cycle of their own, making it harder to reason about things like recovering from network outages
Use for
- Serverless services
- Job/batch applications that work with a push model
- Air-gapped applications that can’t be otherwise reached over the network
Don’t use for
- Long-lived applications
- Scenarios where the agent size grows so large it can become a noisy neighbor
Was this page helpful?
Related resources from Grafana Labs


