
Caution
Grafana Alloy is the new name for our distribution of the OTel collector. Grafana Agent has been deprecated and is in Long-Term Support (LTS) through October 31, 2025. Grafana Agent will reach an End-of-Life (EOL) on November 1, 2025. Read more about why we recommend migrating to Grafana Alloy.
Important: This documentation is about an older version. It's relevant only to the release noted, many of the features and functions have been updated or replaced. Please view the current version.
cloudwatch_exporter_config
Overview
The cloudwatch_exporter_config block configures the cloudwatch_exporter integration, which is an embedded version of
YACE. Use the cloudwatch_exporter to collect AWS CloudWatch metrics.
This integration lets you scrape CloudWatch metrics in a set of configurations that we will call jobs. There are
two kind of jobs: discovery and static.
Authentication
The agent must be running in an environment with access to AWS. The exporter uses the AWS SDK for Go and provides authentication via AWS’s default credential chain. Regardless of the method used to acquire the credentials, some permissions are needed for the exporter to work.
"tag:GetResources",
"cloudwatch:GetMetricData",
"cloudwatch:GetMetricStatistics",
"cloudwatch:ListMetrics"
The following IAM permissions are required for the Transit Gateway attachment (tgwa) metrics to work.
"ec2:DescribeTags",
"ec2:DescribeInstances",
"ec2:DescribeRegions",
"ec2:DescribeTransitGateway*"
The following IAM permission is required to discover tagged API Gateway REST APIs:
"apigateway:GET"The following IAM permissions are required to discover tagged Database Migration Service (DMS) replication instances and tasks:
"dms:DescribeReplicationInstances",
"dms:DescribeReplicationTasks"
To use all of the integration features, use the following AWS IAM Policy:
{
  "Version": "2012-10-17",
  "Statement": [
    {
      "Sid": "Stmt1674249227793",
      "Action": [
        "tag:GetResources",
        "cloudwatch:GetMetricData",
        "cloudwatch:GetMetricStatistics",
        "cloudwatch:ListMetrics",
        "ec2:DescribeTags",
        "ec2:DescribeInstances",
        "ec2:DescribeRegions",
        "ec2:DescribeTransitGateway*",
        "apigateway:GET",
        "dms:DescribeReplicationInstances",
        "dms:DescribeReplicationTasks"
      ],
      "Effect": "Allow",
      "Resource": "*"
    }
  ]
}
Configuration options
Configuration reference:
  #
  # Common Integration Settings
  #

  # Enables the cloudwatch_exporter integration, allowing the Agent to automatically
  # collect CloudWatch metrics as configured.
  [enabled: <boolean> | default = false]

  # Sets an explicit value for the instance label when the integration is
  # self-scraped. Overrides inferred values.
  #
  # The default value for this integration is a hash of the whole integration configuration.
  [instance: <string>]

  # Automatically collect metrics from this integration. If disabled,
  # the cloudwatch_exporter integration is run but not scraped and thus not
  # remote-written. Metrics for the integration are exposed at
  # /integrations/cloudwatch_exporter/metrics and can be scraped by an external
  # process.
  [scrape_integration: <boolean> | default = <integrations_config.scrape_integrations>]

  # How often should the metrics be collected. Defaults to
  # prometheus.global.scrape_interval.
  [scrape_interval: <duration> | default = <global_config.scrape_interval>]

  # The timeout before considering the scrape a failure. Defaults to
  # prometheus.global.scrape_timeout.
  [scrape_timeout: <duration> | default = <global_config.scrape_timeout>]

  # Allows for relabeling labels on the target.
  relabel_configs:
    [- <relabel_config> ... ]

  # Relabel metrics coming from the integration, allowing to drop series
  # from the integration that you don't care about.
  metric_relabel_configs:
    [ - <relabel_config> ... ]

  # How frequent to truncate the WAL for this integration.
  [wal_truncate_frequency: <duration> | default = "60m"]

  #
  # Exporter-specific configuration options
  #

  # Required: AWS region to use when calling STS (https://docs.aws.amazon.com/STS/latest/APIReference/welcome.html) for retrieving
  # account information.
  # Ex: us-east-2
  sts_region: <string>

  discovery:

    # Optional: List of tags (value) per service (key) to export in all metrics. For example defining the ["name", "type"] under
    # AWS/EC2 will export the name and type tags and its values as labels in all metrics. Affects all discovery jobs.
    # Ex:
    # exported_tags:
    #   AWS/EC2:
    #     - name
    exported_tags:
      { <string>: [ <string> ] }

    # List of discovery jobs
    jobs: [ <discovery_job> ]

  # List of static jobs
  static: [ <static_job> ]
discovery_job
A discovery job allows one to just define the AWS service to scrape, and the metrics under that service/namespace to retrieve. The agent will find AWS resources in the specified service for which to scrape these metrics, label them appropriately, and export them to Prometheus. For example, if we wanted to scrape CPU utilization and network traffic metrics, from all AWS EC2 instances:
sts_region: us-east-2
discovery:
  jobs:
    - type: AWS/EC2
      regions:
        - us-east-2
      metrics:
        - name: CPUUtilization
          period: 5m
          statistics:
            - Average
        - name: NetworkPacketsIn
          period: 5m
          statistics:
            - Average
Configuration reference:
  # Required: List of AWS regions.
  regions: [ <string> ]

  # Optional: List of IAM roles to assume. Defaults to the role on the environment configured AWS role.
  roles: [ <aws_role> ]

  # Required: Cloudwatch service alias ("alb", "ec2", etc) or namespace name ("AWS/EC2", "AWS/S3", etc). See section below for all
  # supported.
  type: <string>

  # Optional: List of `Key/Value` pairs to use for tag filtering (all must match). Value can be a regex.
  search_tags: [ <aws_tag> ]

  # Optional: Custom tags to be added as a list of `Key/Value` pairs. When exported to Prometheus format, the label name follows
  # the following format: `custom_tag_{Key}`.
  custom_tags: [ <aws_tag> ]

  # Required: List of metric definitions to scrape.
  metrics: [ <metric> ]
static_job
A static job allows one to scrape an individual CloudWatch metric. For that, metrics needs to be fully qualified, specifying the following:
namespace: For exampleAWS/EC2,AWS/EBS,CoolAppif it were a custom metric, etc.dimensions: CloudWatch identifies a metrics by a set of dimensions. For example, allAWS/EC2metrics are identified by theInstanceIddimension.metrics: Metric name and statistics.
For example, if one wants to scrape the same metrics in the discovery example, but for a specific AWS EC2 instance:
sts_region: us-east-2
static:
  - name: single_ec2_instance
    regions:
      - us-east-2
    namespace: AWS/EC2
    dimensions:
      - name: InstanceId
        value: i-0e43cee369aa44b52
    metrics:
      - name: CPUUtilization
        period: 5m
        statistics:
          - Average
      - name: NetworkPacketsIn
        period: 5m
        statistics:
          - Average
All dimensions need to be specified when scraping single metrics like the example above. For example AWS/Logs metrics
require Resource, Service, Class, and Type dimensions to be specified. Same applies to CloudWatch custom metrics,
all dimensions attached to a metric when saved in CloudWatch are required.
Configuration reference:
  # Required: List of AWS regions.
  regions: [ <string> ]

  # Optional: List of IAM roles to assume. Defaults to the role on the environment configured AWS role.
  roles: [ <aws_role> ]

  # Required: Identifier of the static scraping job. When exported to Prometheus format corresponds to the `name` label.
  name: <string>

  # Required: CloudWatch namespace
  namespace: <string>

  # Required: CloudWatch metric dimensions as a list of Name/Value pairs. Must uniquely define a single metric.
  dimensions: [ <aws_dimension> ]

  # Optional: Custom tags to be added as a list of Key/Value pairs. When exported, the label name follows the following format:
  # `custom_tag_{Key}`.
  custom_tags: [ <aws_tag> ]

  # Required: List of metric definitions to scrape.
  metrics: [ <metric> ]
aws_role
Represents an AWS IAM Role. Required when configuring a job. If omitted the AWS role that the credentials configured in the environment posses will be used.
This is useful when scraping metrics from different AWS accounts with a single pair of credentials. In this case, a different role is configured for the agent to assume prior to calling AWS APIs, therefore, the credentials configured in the system need permission to assume the target role. See this documentation on how to configure this.
  # Required: AWS IAM Role ARN the exporter should assume to perform AWS API calls.
  role_arn: <string>

  # Optional: External ID used when calling STS AssumeRole API. See https://docs.aws.amazon.com/IAM/latest/UserGuide/id_roles_create_for-user_externalid.html for details.
  external_id: <string>
aws_dimension
Represents an AWS CloudWatch Dimension.
  name: <string>
  value: <string>
aws_tag
Represents an AWS Tag.
  key: <string>
  value: <string>
metric
Represents an AWS Metrics to scrape, under the context of a job. To see available metrics, AWS does not keep a documentation page with all available metrics. Follow this guide on how to explore metrics, to easily pick the ones you need.
  # Required: CloudWatch metric name.
  name: <string>

  # Required: List of statistic types, e.g. "Minimum", "Maximum", etc.
  statistics: [ <string> ]

  # Optional: See the `Period` section below.
  period: [ <duration> | default = 5m ]
Period
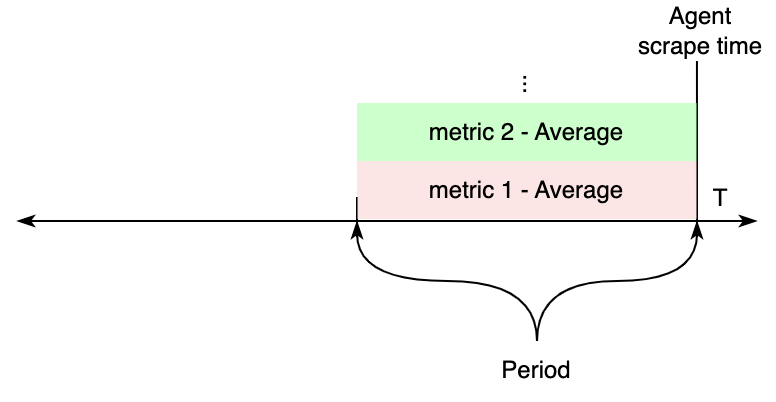
Period controls how far back in time CloudWatch metrics are considered, during each agent scrape. We can split how these settings affects the produced values in two different scenarios.
If all metrics within a job (discovery or static) have the same Period value configured, CloudWatch APIs will be requested
for metrics from the scrape time, to Periods seconds in the past. The values of these are exported to Prometheus.
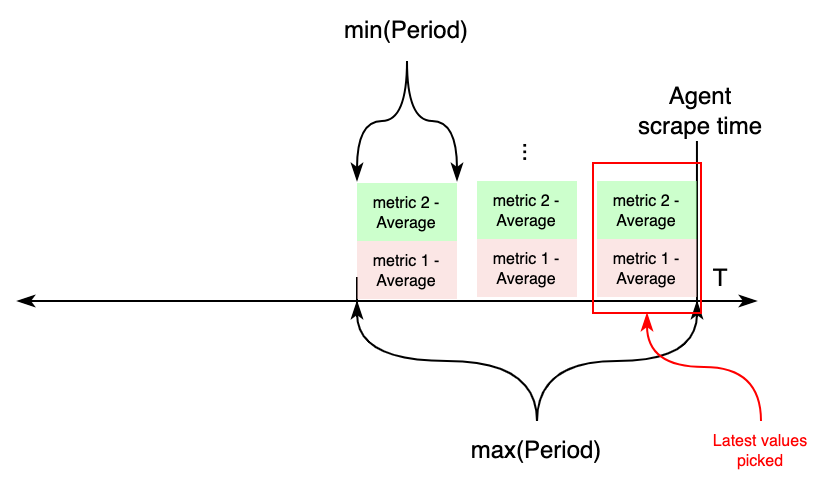
On the other hand, if metrics with different Periods are configured under an individual job, this works differently.
First, two variables are calculated aggregating all periods: length, taking the maximum value of all periods, and
the new period value, taking the minimum of all periods. Then, CloudWatch APIs will be requested for metrics from
now - length to now, aggregating each in samples for period seconds. For each metrics, the most recent sample
is exported to CloudWatch.
Supported services in discovery jobs
The following is a list of AWS services that are supported in cloudwatch_exporter discovery jobs. When configuring a
discovery job, the type field of each discovery_job must match either the desired job namespace or alias.
- Namespace:
AWS/CertificateManageror Alias:acm - Namespace:
AmazonMWAAor Alias:airflow - Namespace:
AWS/ApplicationELBor Alias:alb - Namespace:
AWS/AppStreamor Alias:appstream - Namespace:
AWS/Backupor Alias:backup - Namespace:
AWS/ApiGatewayor Alias:apigateway - Namespace:
AWS/AmazonMQor Alias:mq - Namespace:
AWS/AppSyncor Alias:appsync - Namespace:
AWS/Athenaor Alias:athena - Namespace:
AWS/AutoScalingor Alias:asg - Namespace:
AWS/ElasticBeanstalkor Alias:beanstalk - Namespace:
AWS/Billingor Alias:billing - Namespace:
AWS/Cassandraor Alias:cassandra - Namespace:
AWS/CloudFrontor Alias:cloudfront - Namespace:
AWS/Cognitoor Alias:cognito-idp - Namespace:
AWS/DMSor Alias:dms - Namespace:
AWS/DDoSProtectionor Alias:shield - Namespace:
AWS/DocDBor Alias:docdb - Namespace:
AWS/DXor Alias:dx - Namespace:
AWS/DynamoDBor Alias:dynamodb - Namespace:
AWS/EBSor Alias:ebs - Namespace:
AWS/ElastiCacheor Alias:ec - Namespace:
AWS/EC2or Alias:ec2 - Namespace:
AWS/EC2Spotor Alias:ec2Spot - Namespace:
AWS/ECSor Alias:ecs-svc - Namespace:
ECS/ContainerInsightsor Alias:ecs-containerinsights - Namespace:
AWS/EFSor Alias:efs - Namespace:
AWS/ELBor Alias:elb - Namespace:
AWS/ElasticMapReduceor Alias:emr - Namespace:
AWS/EMRServerlessor Alias:emr-serverless - Namespace:
AWS/ESor Alias:es - Namespace:
AWS/Firehoseor Alias:firehose - Namespace:
AWS/FSxor Alias:fsx - Namespace:
AWS/GameLiftor Alias:gamelift - Namespace:
AWS/GlobalAcceleratoror Alias:ga - Namespace:
Glueor Alias:glue - Namespace:
AWS/IoTor Alias:iot - Namespace:
AWS/Kafkaor Alias:kafka - Namespace:
AWS/KafkaConnector Alias:kafkaconnect - Namespace:
AWS/Kinesisor Alias:kinesis - Namespace:
AWS/KinesisAnalyticsor Alias:kinesis-analytics - Namespace:
AWS/Lambdaor Alias:lambda - Namespace:
AWS/MediaTailoror Alias:mediatailor - Namespace:
AWS/Neptuneor Alias:neptune - Namespace:
AWS/NetworkFirewallor Alias:nfw - Namespace:
AWS/NATGatewayor Alias:ngw - Namespace:
AWS/NetworkELBor Alias:nlb - Namespace:
AWS/PrivateLinkEndpointsor Alias:vpc-endpoint - Namespace:
AWS/PrivateLinkServicesor Alias:vpc-endpoint-service - Namespace:
AWS/Prometheusor Alias:amp - Namespace:
AWS/RDSor Alias:rds - Namespace:
AWS/Redshiftor Alias:redshift - Namespace:
AWS/Route53Resolveror Alias:route53-resolver - Namespace:
AWS/Route53or Alias:route53 - Namespace:
AWS/S3or Alias:s3 - Namespace:
AWS/SESor Alias:ses - Namespace:
AWS/Statesor Alias:sfn - Namespace:
AWS/SNSor Alias:sns - Namespace:
AWS/SQSor Alias:sqs - Namespace:
AWS/StorageGatewayor Alias:storagegateway - Namespace:
AWS/TransitGatewayor Alias:tgw - Namespace:
AWS/VPNor Alias:vpn - Namespace:
AWS/WAFV2or Alias:wafv2 - Namespace:
AWS/WorkSpacesor Alias:workspaces
Was this page helpful?
Related resources from Grafana Labs


