Caution
Grafana Agent has reached End-of-Life (EOL) on November 1, 2025. Agent is no longer receiving vendor support and will no longer receive security or bug fixes. Current users of Agent Static mode, Agent Flow mode, and Agent Operator should proceed with migrating to Grafana Alloy. If you have already migrated to Alloy, no further action is required. Read more about why we recommend migrating to Grafana Alloy.
Filter Prometheus metrics
In this tutorial, you’ll add a new component prometheus.relabel using relabel.river to filter metrics. This tutorial uses the same base as Collecting Prometheus metrics.
Prerequisites
Run the example
The prometheus.relabel component is used to drop, add, or filter metrics.
Run the following:
curl https://raw.githubusercontent.com/grafana/agent/main/docs/sources/flow/tutorials/assets/runt.sh -O && bash ./runt.sh relabel.riverThe runt.sh script does:
- Downloads the configurations necessary for Mimir, Grafana and Grafana Agent.
- Downloads the docker image for Grafana Agent explicitly.
- Runs the docker-compose up command to bring all the services up.
Allow Grafana Agent to run for two minutes, then navigate to Grafana page and the service label will be there with the api_server value.

What’s happening?
- The Prometheus scraper is sending the metrics to the filter.
- The filter is adding a new label named
servicewith the valueapi_server. - The filter is then sending metrics to the remote_write endpoint.
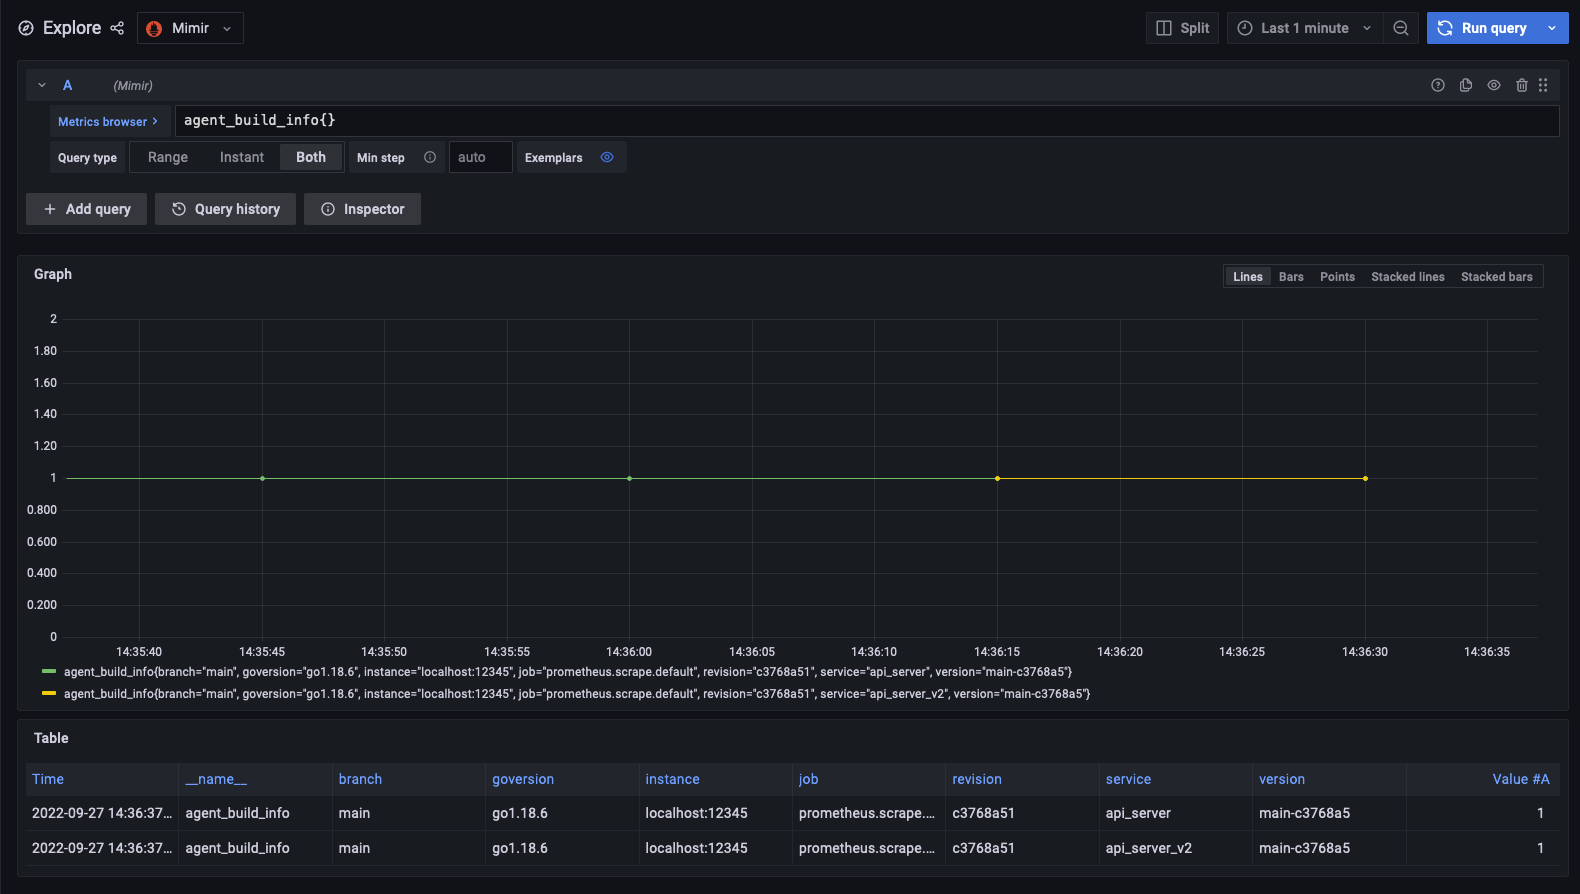
Update the service value
Open the relabel.river file that was downloaded and change the name of the service to api_server_v2, then run bash ./runt.sh relabel.river. Allow Grafana Agent to run for two minutes, then navigate to the Grafana page, and the new label will be updated. The old value api_server may still show up in the graph but hovering over the lines will show that that value stopped being scraped and was replaced with api_server_v2.