Caution
Grafana Agent has reached End-of-Life (EOL) on November 1, 2025. Agent is no longer receiving vendor support and will no longer receive security or bug fixes. Current users of Agent Static mode, Agent Flow mode, and Agent Operator should proceed with migrating to Grafana Alloy. If you have already migrated to Alloy, no further action is required. Read more about why we recommend migrating to Grafana Alloy.
Collect Prometheus metrics
Grafana Agent is a telemetry collector with the primary goal of moving telemetry data from one location to another. In this tutorial, you’ll set up Grafana Agent Flow.
Prerequisites
Run the example
Run the following command in a terminal window:
curl https://raw.githubusercontent.com/grafana/agent/main/docs/sources/flow/tutorials/assets/runt.sh -O && bash ./runt.sh agent.riverThe runt.sh script does:
- Downloads the configurations necessary for Mimir, Grafana, and Grafana Agent.
- Downloads the docker image for Grafana Agent explicitly.
- Runs the docker-compose up command to bring all the services up.
Allow Grafana Agent to run for two minutes, then navigate to Grafana.
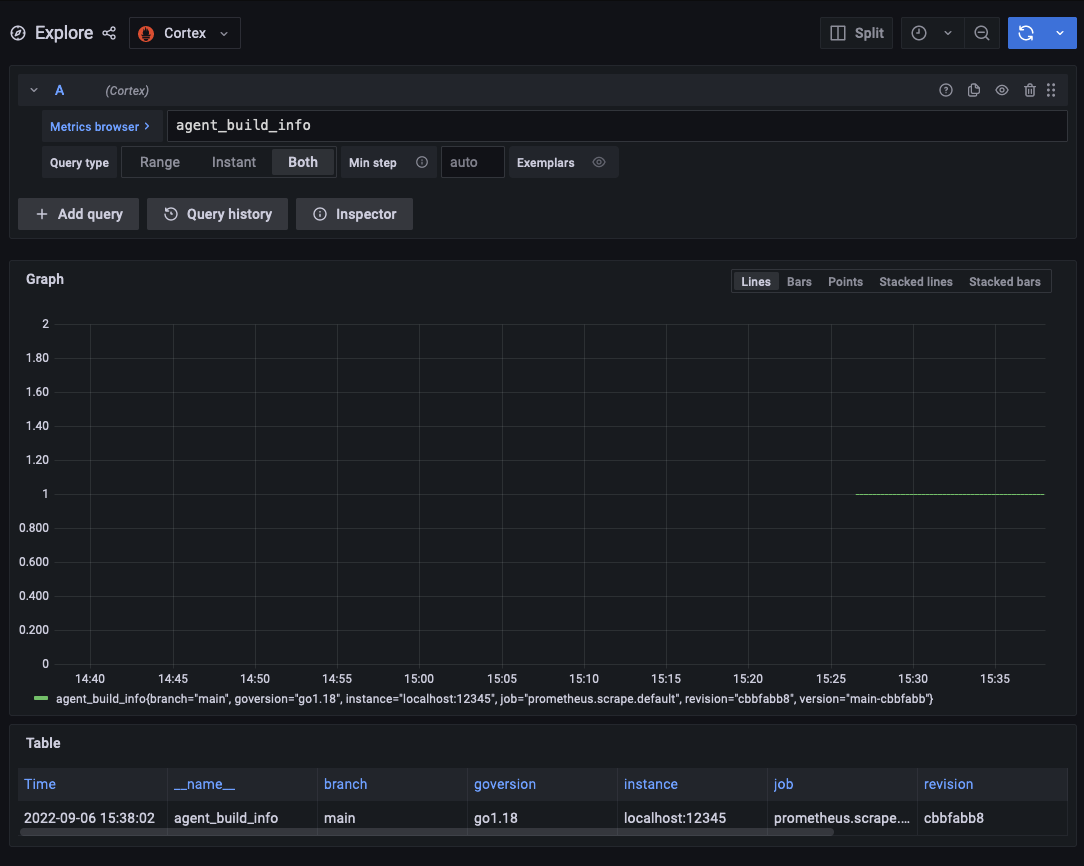
This example scrapes the Grafana Agent Flow http://localhost:12345/metrics endpoint and pushes those metrics to the Mimir instance.
Navigate to http://localhost:12345/graph to view the Grafana Agent Flow UI.
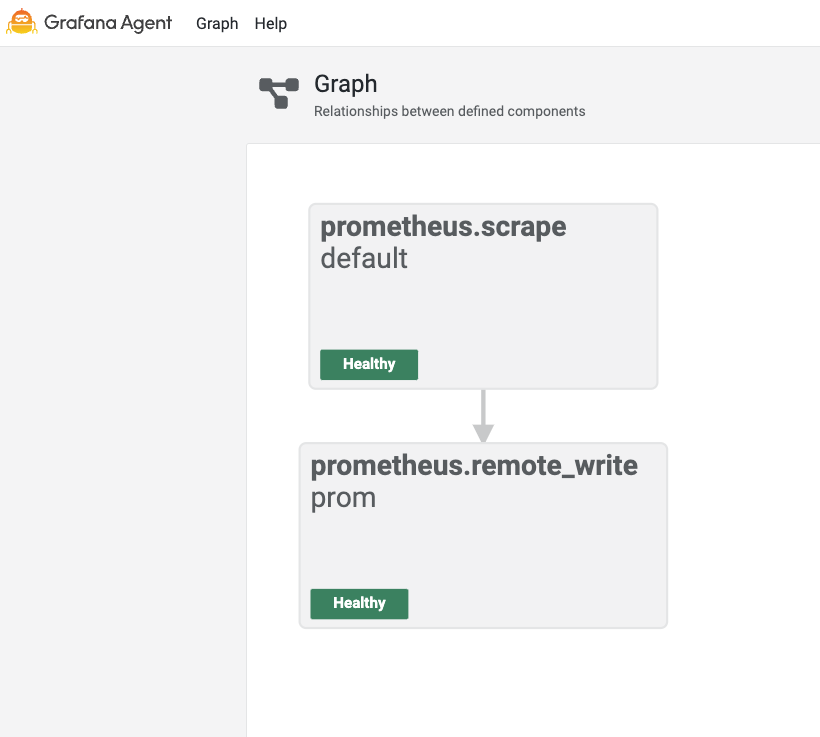
Grafana Agent displays the component pipeline in a dependency graph. See Scraping component and Remote Write component for details about the components used in this configuration. Click the nodes to navigate to the associated component page. There, you can view the state, health information, and, if applicable, the debug information.
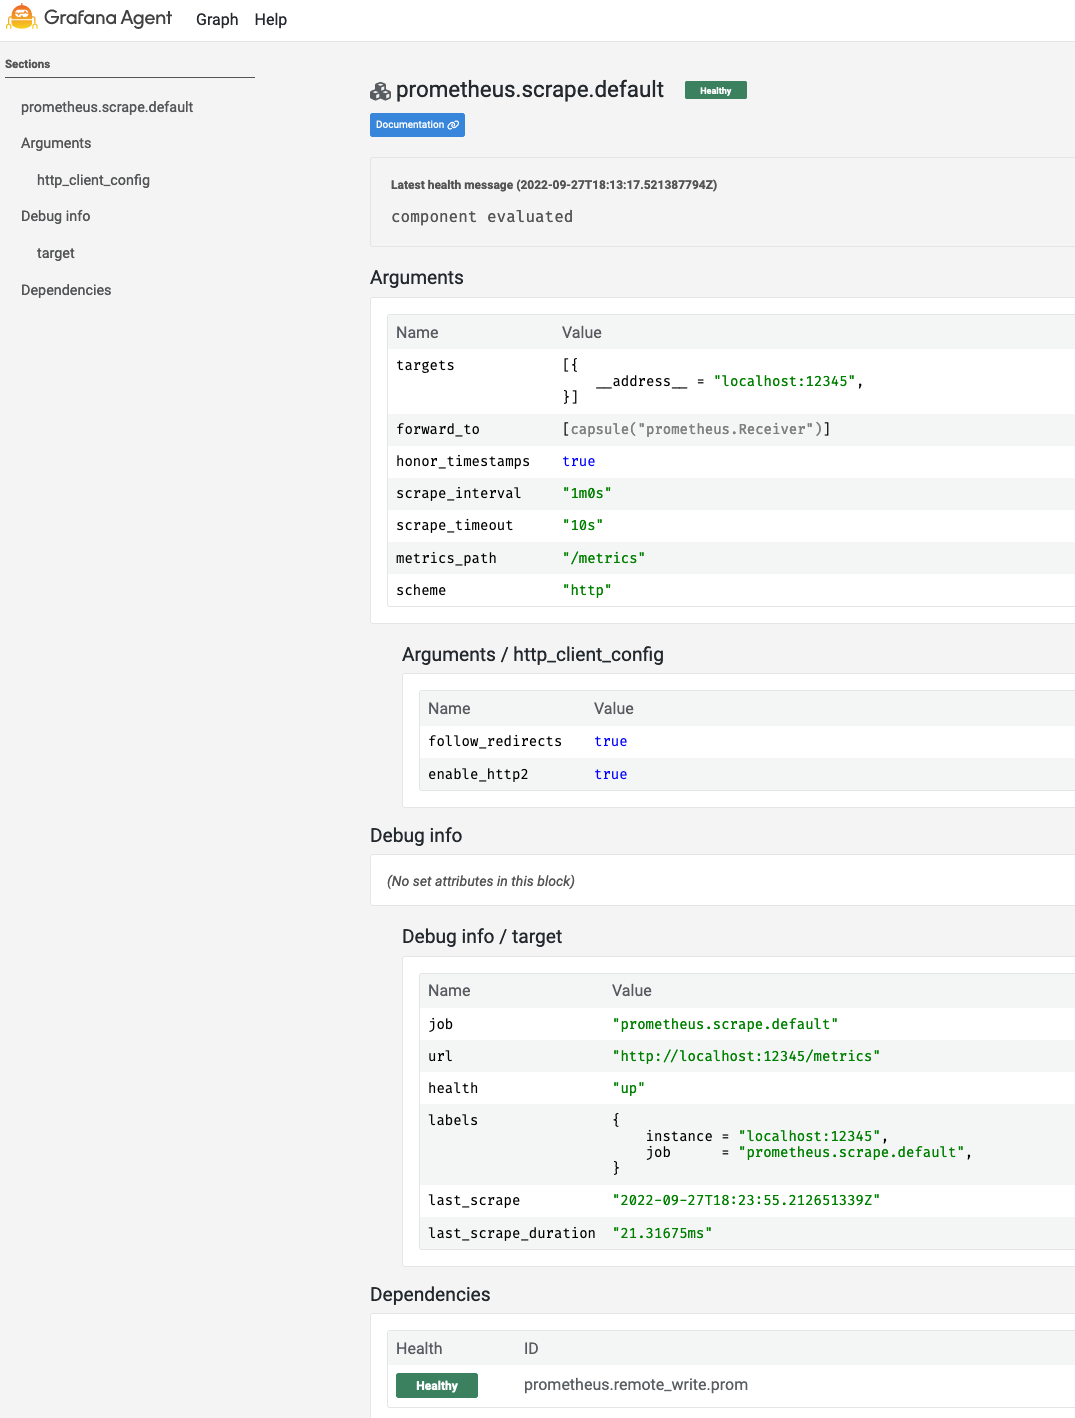
Scraping component
The
prometheus.scrape component is responsible for scraping the metrics of a particular endpoint and passing them on to another component.
// prometheus.scrape is the name of the component and "default" is its label.
prometheus.scrape "default" {
    // Tell the scraper to scrape at http://localhost:12345/metrics.
    // The http:// and metrics are implied but able to be overwritten.
    targets = [{"__address__" = "localhost:12345"}]
    // Forward the scrape results to the receiver. In general,
    // Flow uses forward_to to tell which receiver to send results to.
    // The forward_to is an argument of prometheus.scrape.default and
    // the receiver is an exported field of prometheus.remote_write.prom.
    forward_to = [prometheus.remote_write.prom.receiver]
}
The prometheus.scrape "default" annotation indicates the name of the component, prometheus.scrape, and its label, default. All components must have a unique combination of name and if applicable label.
The targets
attribute is an
argument. targets is a list of labels that specify the target via the special key __address__. The scraper is targeting the Grafana Agent Flow /metrics endpoint. Both http and /metrics are implied but can be overridden.
The forward_to attribute is an argument that references the
export of the prometheus.remote_write.prom component. This is where the scraper will send the metrics for further processing.
Remote Write component
The
prometheus.remote_write component is responsible for writing the metrics to a Prometheus-compatible endpoint (Mimir).
prometheus.remote_write "prom" {
    endpoint {
        url = "http://mimir:9009/api/v1/push"
    }
}
Running without Docker
To try out Grafana Agent without using Docker:
- Download Grafana Agent.
- Set the environment variable
AGENT_MODE=flow. - Run the Grafana Agent with
grafana-agent run <path_to_flow_config>.


