Caution
Grafana Agent has reached End-of-Life (EOL) on November 1, 2025. Agent is no longer receiving vendor support and will no longer receive security or bug fixes. Current users of Agent Static mode, Agent Flow mode, and Agent Operator should proceed with migrating to Grafana Alloy. If you have already migrated to Alloy, no further action is required. Read more about why we recommend migrating to Grafana Alloy.
OpenTelemetry to Grafana stack
You can configure Grafana Agent Flow to collect OpenTelemetry-compatible data and forward it to the Grafana stack.
This topic describes how to:
- Configure Grafana Agent Flow to send your data to Loki.
- Configure Grafana Agent Flow to send your data to Tempo.
- Configure Grafana Agent Flow to send your data to Mimir or Prometheus Remote Write.
Components used in this topic
- loki.write
- otelcol.auth.basic
- otelcol.exporter.loki
- otelcol.exporter.otlp
- otelcol.exporter.prometheus
- otelcol.processor.batch
- otelcol.receiver.otlp
- prometheus.remote_write
Before you begin
- Ensure that you have basic familiarity with instrumenting applications with OpenTelemetry.
- Have a set of OpenTelemetry applications ready to push telemetry data to Grafana Agent Flow.
- Identify where Grafana Agent Flow will write received telemetry data.
- Be familiar with the concept of Components in Grafana Agent Flow.
- Complete the Collect open telemetry data task. You will pick up from where that guide ended.
The pipeline
You can start with the Grafana Agent Flow configuration you created in the Collect open telemetry data task.
otelcol.receiver.otlp "example" {
  grpc {
    endpoint = "127.0.0.1:4317"
  }

  http {
    endpoint = "127.0.0.1:4318"
  }

  output {
    metrics = [otelcol.processor.batch.example.input]
    logs    = [otelcol.processor.batch.example.input]
    traces  = [otelcol.processor.batch.example.input]
  }
}

otelcol.processor.batch "example" {
  output {
    metrics = [otelcol.exporter.otlp.default.input]
    logs    = [otelcol.exporter.otlp.default.input]
    traces  = [otelcol.exporter.otlp.default.input]
  }
}

otelcol.exporter.otlp "default" {
  client {
    endpoint = "my-otlp-grpc-server:4317"
  }
}
The pipeline currently looks like this:
Metrics, Logs, Traces: OTLP Receiver → batch processor → OTLP ExporterYou will implement the following pipelines to send your data to Loki, Tempo, and Mimir or Prometheus.
Metrics: OTel → batch processor → Mimir or Prometheus remote write
Logs: OTel → batch processor → Loki exporter
Traces: OTel → batch processor → OTel exporter
Grafana Loki
Grafana Loki is a horizontally scalable, highly available, multi-tenant log aggregation system inspired by Prometheus. Similar to Prometheus, to send from OTLP to Loki, you can do a passthrough from the otelcol.exporter.loki component to loki.write component.
otelcol.exporter.loki "default" {
forward_to = [loki.write.default.receiver]
}
loki.write "default" {
endpoint {
url = "http://loki-endpoint:8080/loki/api/v1/push"
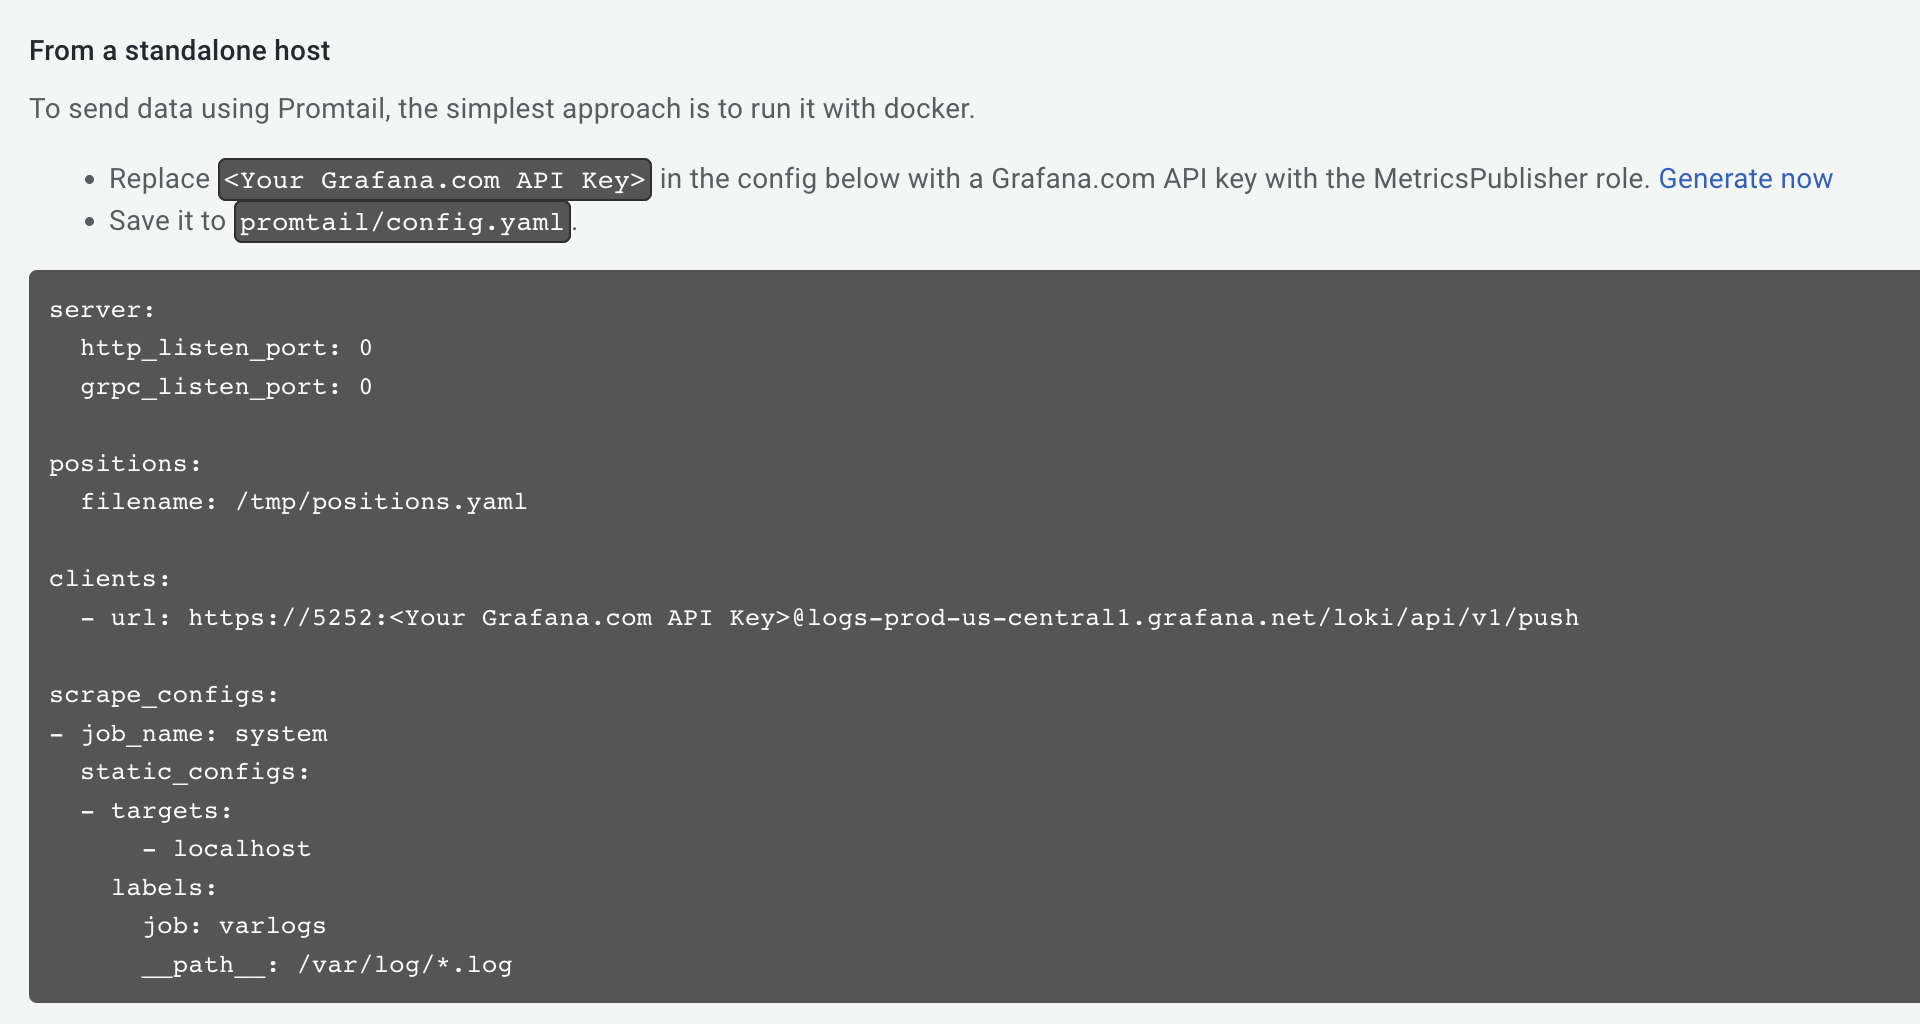
}To use Loki with basic-auth, which is required with Grafana Cloud Loki, you must configure the loki.write component. You can get the Loki configuration from the Loki Details page in the Grafana Cloud Portal:
otelcol.exporter.loki "grafana_cloud_loki" {
	forward_to = [loki.write.grafana_cloud_loki.receiver]
}

loki.write "grafana_cloud_loki" {
	endpoint {
		url = "https://logs-prod-us-central1.grafana.net/loki/api/v1/push"

		basic_auth {
			username = 5252
			password = env("GRAFANA_CLOUD_API_KEY")
		}
	}
}
Grafana Tempo
Grafana Tempo is an open source, easy-to-use, scalable distributed tracing backend. Tempo can ingest OTLP directly, and you can use the OTLP exporter to send the traces to Tempo.
otelcol.exporter.otlp "default" {
  client {
    endpoint = "tempo-server:4317"
  }
}
To use Tempo with basic-auth, which is required with Grafana Cloud Tempo, you must use the otelcol.auth.basic component. You can get the Tempo configuration from the Tempo Details page in the Grafana Cloud Portal:

otelcol.exporter.otlp "grafana_cloud_tempo" {
	client {
		endpoint = "tempo-us-central1.grafana.net:443"
		auth     = otelcol.auth.basic.grafana_cloud_tempo.handler
	}
}

otelcol.auth.basic "grafana_cloud_tempo" {
	username = 4094
	password = env("GRAFANA_CLOUD_API_KEY")
}
Grafana Mimir or Prometheus Remote Write
Prometheus Remote Write is a popular metrics transmission protocol supported by most metrics systems, including Grafana Mimir and Grafana Cloud. To send from OTLP to Prometheus, you can do a passthrough from the otelcol.exporter.prometheus to the prometheus.remote_write component. The Prometheus remote write component in Grafana Agent Flow is a robust protocol implementation, including a Write Ahead Log (WAL) for resiliency.
otelcol.exporter.prometheus "default" {
forward_to = [prometheus.remote_write.default.receiver]
}
prometheus.remote_write "default" {
endpoint {
url = "http://prometheus:9090/api/v1/write"
}
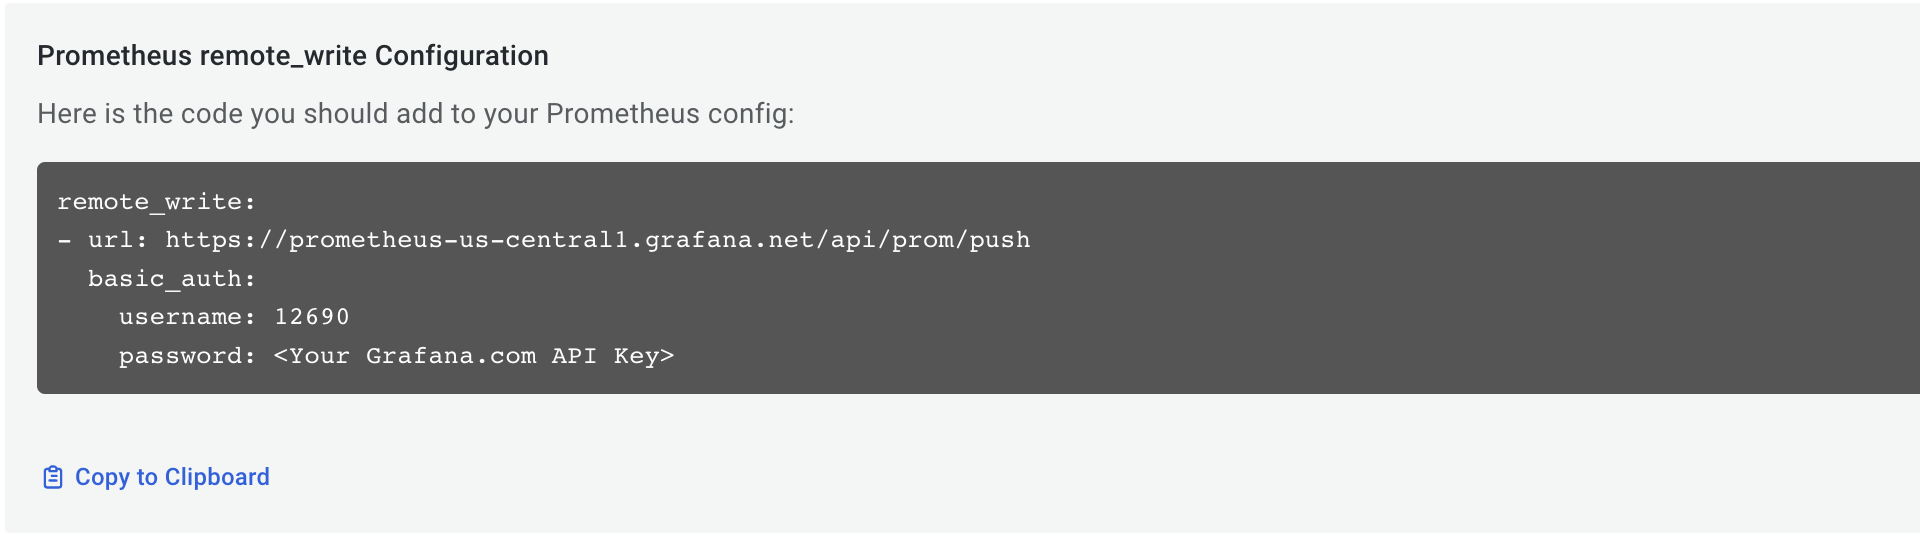
}To use Prometheus with basic-auth, which is required with Grafana Cloud Prometheus, you must configure the prometheus.remote_write component. You can get the Prometheus configuration from the Prometheus Details page in the Grafana Cloud Portal:
otelcol.exporter.prometheus "grafana_cloud_prometheus" {
forward_to = [prometheus.remote_write.grafana_cloud_prometheus.receiver]
}
prometheus.remote_write "grafana_cloud_prometheus" {
endpoint {
url = "https://prometheus-us-central1.grafana.net/api/prom/push"
basic_auth {
username = 12690
password = env("GRAFANA_CLOUD_API_KEY")
}
}
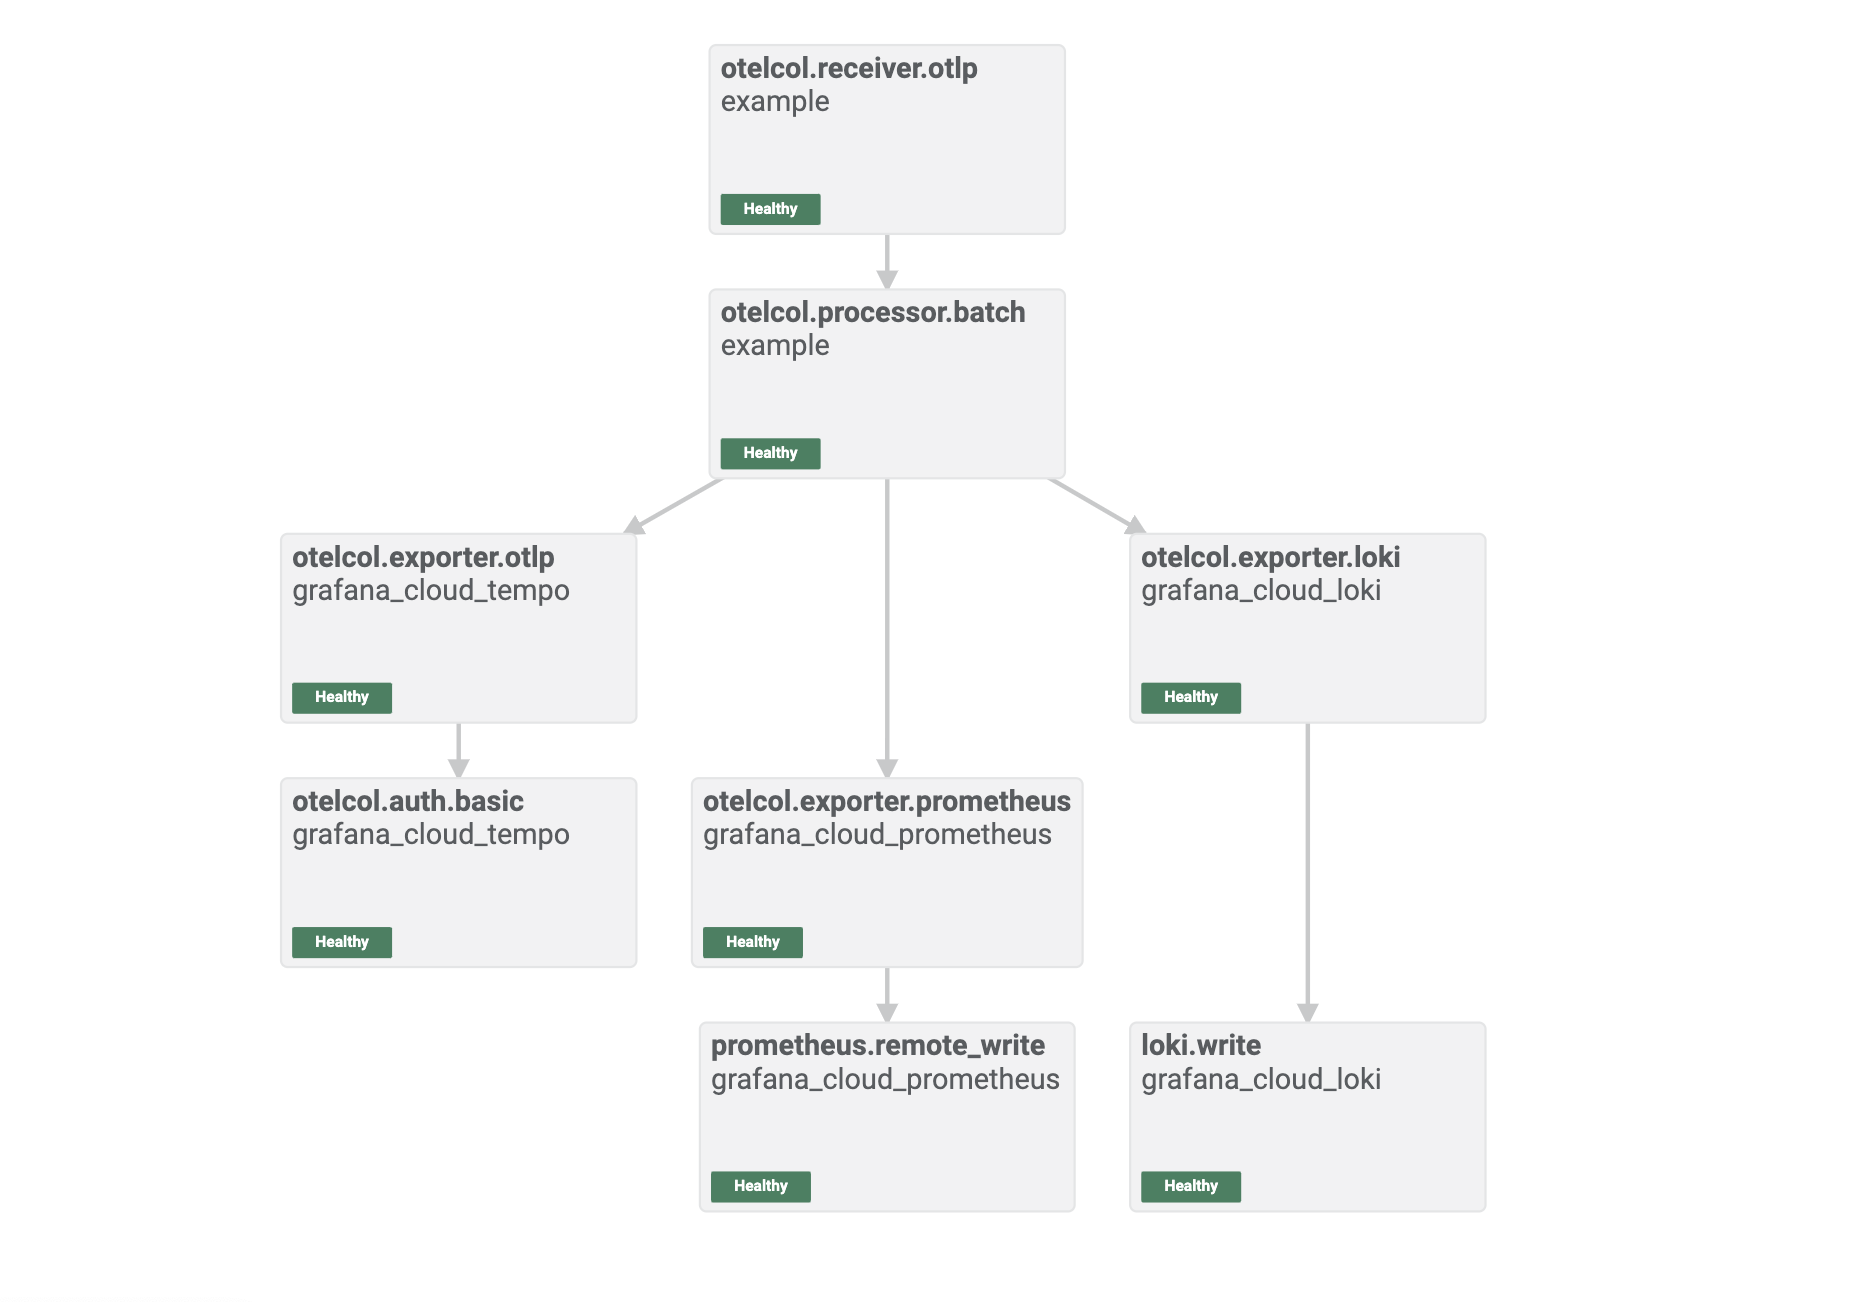
}Putting it all together
Instead of referencing otelcol.exporter.otlp.default.input in the output of otelcol.processor.batch, you need to reference the three exporters you set up.
The final configuration becomes:
otelcol.receiver.otlp "example" {
  grpc {
    endpoint = "127.0.0.1:4317"
  }

  http {
    endpoint = "127.0.0.1:4318"
  }

  output {
    metrics = [otelcol.processor.batch.example.input]
    logs    = [otelcol.processor.batch.example.input]
    traces  = [otelcol.processor.batch.example.input]
  }
}

otelcol.processor.batch "example" {
  output {
    metrics = [otelcol.exporter.prometheus.grafana_cloud_prometheus.input]
    logs    = [otelcol.exporter.loki.grafana_cloud_loki.input]
    traces  = [otelcol.exporter.otlp.grafana_cloud_tempo.input]
  }
}

otelcol.exporter.otlp "grafana_cloud_tempo" {
	client {
		endpoint = "tempo-us-central1.grafana.net:443"
		auth     = otelcol.auth.basic.grafana_cloud_tempo.handler
	}
}

otelcol.auth.basic "grafana_cloud_tempo" {
	username = 4094
	password = env("GRAFANA_CLOUD_API_KEY")
}

otelcol.exporter.prometheus "grafana_cloud_prometheus" {
        forward_to = [prometheus.remote_write.grafana_cloud_prometheus.receiver]
    }

prometheus.remote_write "grafana_cloud_prometheus" {
    endpoint {
        url = "https://prometheus-us-central1.grafana.net/api/prom/push"

        basic_auth {
            username = 12690
            password = env("GRAFANA_CLOUD_API_KEY")
        }
    }
}

otelcol.exporter.loki "grafana_cloud_loki" {
	forward_to = [loki.write.grafana_cloud_loki.receiver]
}

loki.write "grafana_cloud_loki" {
	endpoint {
		url = "https://logs-prod-us-central1.grafana.net/loki/api/v1/push"

		basic_auth {
			username = 5252
			password = env("GRAFANA_CLOUD_API_KEY")
		}
	}
}
Running Grafana Agent Flow now will give you the following:
AGENT_MODE=flow ./grafana-agent run agent-config.river
AGENT_MODE=flow ./grafana-agent run agent-config.river
ts=2023-05-09T09:37:15.300959Z level=info msg="running usage stats reporter"
ts=2023-05-09T09:37:15.300958Z level=info msg="now listening for http traffic" addr=127.0.0.1:12345
ts=2023-05-09T09:37:15.301104Z level=info trace_id=6466516c9e1a556422df7a84c0ade6b0 msg="starting complete graph evaluation"
ts=2023-05-09T09:37:15.301307Z level=info trace_id=6466516c9e1a556422df7a84c0ade6b0 msg="finished node evaluation" node_id=loki.write.grafana_cloud_loki duration=188.209µs
ts=2023-05-09T09:37:15.301334Z level=info trace_id=6466516c9e1a556422df7a84c0ade6b0 msg="finished node evaluation" node_id=otelcol.exporter.loki.grafana_cloud_loki duration=18.791µs
ts=2023-05-09T09:37:15.303138Z component=prometheus.remote_write.grafana_cloud_prometheus level=info subcomponent=wal msg="replaying WAL, this may take a while" dir=data-agent/prometheus.remote_write.grafana_cloud_prometheus/wal
ts=2023-05-09T09:37:15.303257Z component=prometheus.remote_write.grafana_cloud_prometheus level=info subcomponent=wal msg="WAL segment loaded" segment=0 maxSegment=1
ts=2023-05-09T09:37:15.303302Z component=prometheus.remote_write.grafana_cloud_prometheus level=info subcomponent=wal msg="WAL segment loaded" segment=1 maxSegment=1
ts=2023-05-09T09:37:15.303507Z component=prometheus.remote_write.grafana_cloud_prometheus subcomponent=rw level=info remote_name=7f623a url=https://prometheus-us-central1.grafana.net/api/prom/push msg="Starting WAL watcher" queue=7f623a
ts=2023-05-09T09:37:15.303515Z component=prometheus.remote_write.grafana_cloud_prometheus subcomponent=rw level=info remote_name=7f623a url=https://prometheus-us-central1.grafana.net/api/prom/push msg="Starting scraped metadata watcher"
ts=2023-05-09T09:37:15.303522Z level=info trace_id=6466516c9e1a556422df7a84c0ade6b0 msg="finished node evaluation" node_id=prometheus.remote_write.grafana_cloud_prometheus duration=2.181958ms
ts=2023-05-09T09:37:15.303557Z level=info trace_id=6466516c9e1a556422df7a84c0ade6b0 msg="finished node evaluation" node_id=otelcol.exporter.prometheus.grafana_cloud_prometheus duration=30.083µs
ts=2023-05-09T09:37:15.303611Z component=prometheus.remote_write.grafana_cloud_prometheus subcomponent=rw level=info remote_name=7f623a url=https://prometheus-us-central1.grafana.net/api/prom/push msg="Replaying WAL" queue=7f623a
ts=2023-05-09T09:37:15.303618Z level=info trace_id=6466516c9e1a556422df7a84c0ade6b0 msg="finished node evaluation" node_id=otelcol.auth.basic.grafana_cloud_tempo duration=52.5µs
ts=2023-05-09T09:37:15.303694Z level=info trace_id=6466516c9e1a556422df7a84c0ade6b0 msg="finished node evaluation" node_id=otelcol.exporter.otlp.grafana_cloud_tempo duration=70.375µs
ts=2023-05-09T09:37:15.303782Z component=otelcol.processor.memory_limiter.default level=info msg="Memory limiter configured" limit_mib=150 spike_limit_mib=30 check_interval=1s
ts=2023-05-09T09:37:15.303802Z level=info trace_id=6466516c9e1a556422df7a84c0ade6b0 msg="finished node evaluation" node_id=otelcol.processor.memory_limiter.default duration=100.334µs
ts=2023-05-09T09:37:15.303853Z level=info trace_id=6466516c9e1a556422df7a84c0ade6b0 msg="finished node evaluation" node_id=otelcol.processor.batch.default duration=44.75µs
ts=2023-05-09T09:37:15.303948Z level=info trace_id=6466516c9e1a556422df7a84c0ade6b0 msg="finished node evaluation" node_id=otelcol.receiver.otlp.default duration=87.333µs
ts=2023-05-09T09:37:15.303968Z level=info trace_id=6466516c9e1a556422df7a84c0ade6b0 msg="finished node evaluation" node_id=tracing duration=10.792µs
ts=2023-05-09T09:37:15.303981Z level=info trace_id=6466516c9e1a556422df7a84c0ade6b0 msg="finished node evaluation" node_id=logging duration=9µs
ts=2023-05-09T09:37:15.303987Z level=info trace_id=6466516c9e1a556422df7a84c0ade6b0 msg="finished complete graph evaluation" duration=2.960333ms
ts=2023-05-09T09:37:15.304Z level=info msg="scheduling loaded components"
ts=2023-05-09T09:37:15.304109Z component=otelcol.receiver.otlp.default level=info msg="Starting GRPC server" endpoint=0.0.0.0:4317
ts=2023-05-09T09:37:15.304234Z component=otelcol.receiver.otlp.default level=info msg="Starting HTTP server" endpoint=0.0.0.0:4318
You can now check the pipeline graphically by visiting http://localhost:12345/graph