Caution
Grafana Agent has reached End-of-Life (EOL) on November 1, 2025. Agent is no longer receiving vendor support and will no longer receive security or bug fixes. Current users of Agent Static mode, Agent Flow mode, and Agent Operator should proceed with migrating to Grafana Alloy. If you have already migrated to Alloy, no further action is required. Read more about why we recommend migrating to Grafana Alloy.
prometheus.exporter.cloudwatch
The prometheus.exporter.cloudwatch component
embeds yet-another-cloudwatch-exporter, letting you
collect CloudWatch metrics,
translate them to a prometheus-compatible format and remote write them.
This component lets you scrape CloudWatch metrics in a set of configurations we call jobs. There are two kinds of jobs: discovery and static.
Authentication
Grafana Agent Flow must be running in an environment with access to AWS. The exporter uses the AWS SDK for Go and provides authentication via AWS’s default credential chain. Regardless of the method used to acquire the credentials, some permissions are needed for the exporter to work.
"tag:GetResources",
"cloudwatch:GetMetricData",
"cloudwatch:GetMetricStatistics",
"cloudwatch:ListMetrics"
The following IAM permissions are required for the Transit Gateway attachment (tgwa) metrics to work.
"ec2:DescribeTags",
"ec2:DescribeInstances",
"ec2:DescribeRegions",
"ec2:DescribeTransitGateway*"
The following IAM permission is required to discover tagged API Gateway REST APIs:
"apigateway:GET"The following IAM permissions are required to discover tagged Database Migration Service (DMS) replication instances and tasks:
"dms:DescribeReplicationInstances",
"dms:DescribeReplicationTasks"
To use all of the integration features, use the following AWS IAM Policy:
{
  "Version": "2012-10-17",
  "Statement": [
    {
      "Sid": "Stmt1674249227793",
      "Action": [
        "tag:GetResources",
        "cloudwatch:GetMetricData",
        "cloudwatch:GetMetricStatistics",
        "cloudwatch:ListMetrics",
        "ec2:DescribeTags",
        "ec2:DescribeInstances",
        "ec2:DescribeRegions",
        "ec2:DescribeTransitGateway*",
        "apigateway:GET",
        "dms:DescribeReplicationInstances",
        "dms:DescribeReplicationTasks"
      ],
      "Effect": "Allow",
      "Resource": "*"
    }
  ]
}
Usage
prometheus.exporter.cloudwatch "queues" {
	sts_region = "us-east-2"

	discovery {
		type        = "sqs"
		regions     = ["us-east-2"]
		search_tags = {
			"scrape" = "true",
		}

		metric {
			name       = "NumberOfMessagesSent"
			statistics = ["Sum", "Average"]
			period     = "1m"
		}

		metric {
			name       = "NumberOfMessagesReceived"
			statistics = ["Sum", "Average"]
			period     = "1m"
		}
	}
}
Arguments
You can use the following arguments to configure the exporter’s behavior. Omitted fields take their default values.
Blocks
You can use the following blocks inprometheus.exporter.cloudwatch to configure collector-specific options:
Note
The
staticanddiscoveryblocks are marked as not required, but you must configure at least one static or discovery job.
discovery block
The discovery block allows the component to scrape CloudWatch metrics with only the AWS service and a list of metrics
under that service/namespace.
Grafana Agent Flow will find AWS resources in the specified service for which to scrape these metrics, label them appropriately,
and export them to Prometheus. For example, if we wanted to scrape CPU utilization and network traffic metrics from all AWS EC2 instances:
prometheus.exporter.cloudwatch "discover_instances" {
	sts_region = "us-east-2"

	discovery {
		type    = "AWS/EC2"
		regions = ["us-east-2"]

		metric {
			name       = "CPUUtilization"
			statistics = ["Average"]
			period     = "5m"
		}

		metric {
			name       = "NetworkPacketsIn"
			statistics = ["Average"]
			period     = "5m"
		}
	}
}
You can configure the discovery block one or multiple times to scrape metrics from different services or with
different search_tags.
static block
The static block configures the component to scrape a specific set of CloudWatch metrics. The metrics need to be fully
qualified with the following specifications:
namespace: For example,AWS/EC2,AWS/EBS,CoolAppif it were a custom metric, etc.dimensions: CloudWatch identifies a metric by a set of dimensions, which are essentially label / value pairs. For example, allAWS/EC2metrics are identified by theInstanceIddimension and the identifier itself.metric: Metric name and statistics.
For example, if you want to scrape the same metrics in the discovery example, but for a specific AWS EC2 instance:
prometheus.exporter.cloudwatch "static_instances" {
	sts_region = "us-east-2"

	static "instances" {
		regions    = ["us-east-2"]
		namespace  = "AWS/EC2"
		dimensions = {
			"InstanceId" = "i01u29u12ue1u2c",
		}

		metric {
			name       = "CPUUsage"
			statistics = ["Sum", "Average"]
			period     = "1m"
		}
	}
}
As shown above, static blocks must be specified with a label, which will translate to the name label in the exported
metric.
static "LABEL" {
    regions    = ["us-east-2"]
    namespace  = "AWS/EC2"
    // ...
}
You can configure the static block one or multiple times to scrape metrics with different sets of dimensions.
All dimensions must be specified when scraping single metrics like the example above. For example, AWS/Logs metrics
require Resource, Service, Class, and Type dimensions to be specified. The same applies to CloudWatch custom
metrics,
all dimensions attached to a metric when saved in CloudWatch are required.
metric block
Represents an AWS Metrics to scrape. To see available metrics, AWS does not keep a documentation page with all available metrics. Follow this guide on how to explore metrics, to easily pick the ones you need.
period and length
period controls primarily the width of the time bucket used for aggregating metrics collected from CloudWatch. length
controls how far back in time CloudWatch metrics are considered during each Grafana Agent scrape.
If both settings are configured, the time parameters when calling CloudWatch APIs works as follows:
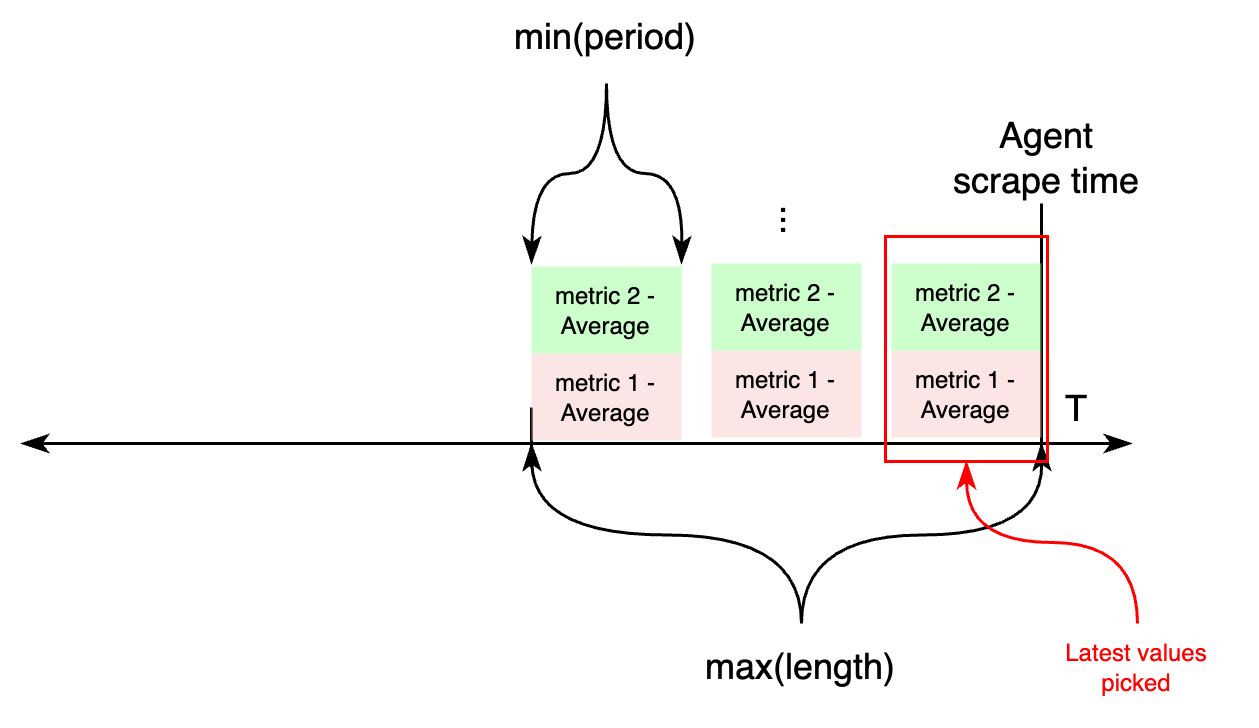
As noted above, if across multiple metrics under the same static or discovery job, there’s different period
and/or length
the minimum of all periods, and maximum of all lengths is configured.
On the other hand, if length is not configured, both period and length settings will be calculated based on the
required
period configuration attribute.
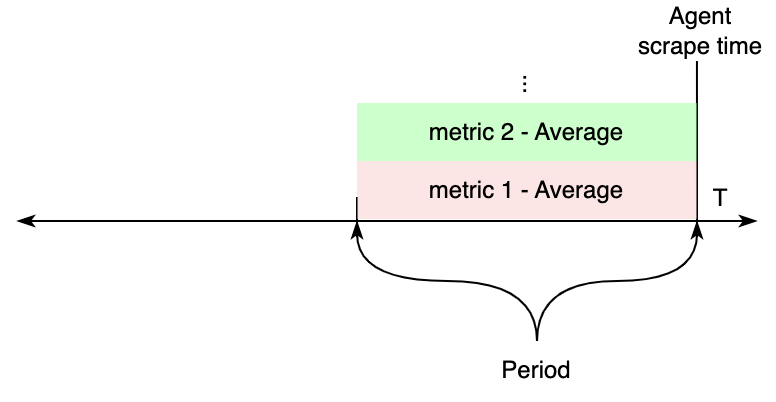
If all metrics within a job (discovery or static) have the same period value configured, CloudWatch APIs will be
requested
for metrics from the scrape time, to periods seconds in the past. The values of these are exported to Prometheus.
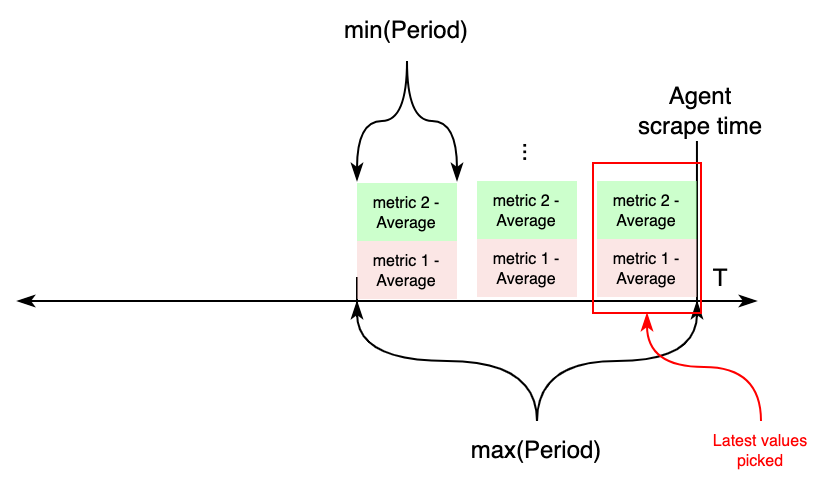
On the other hand, if metrics with different periods are configured under an individual job, this works differently.
First, two variables are calculated aggregating all periods: length, taking the maximum value of all periods, and
the new period value, taking the minimum of all periods. Then, CloudWatch APIs will be requested for metrics from
now - length to now, aggregating each in samples for period seconds. For each metric, the most recent sample
is exported to CloudWatch.
role block
Represents an AWS IAM Role. If omitted, the AWS role that corresponds to the credentials configured in the environment will be used.
Multiple roles can be useful when scraping metrics from different AWS accounts with a single pair of credentials. In this case, a different role is configured for Grafana Agent to assume before calling AWS APIs. Therefore, the credentials configured in the system need permission to assume the target role. See Granting a user permissions to switch roles in the AWS IAM documentation for more information about how to configure this.
decoupled_scraping block
The decoupled_scraping block configures an optional feature that scrapes CloudWatch metrics in the background on a
scheduled interval. When this feature is enabled, CloudWatch metrics are gathered asynchronously at the scheduled interval instead
of synchronously when the CloudWatch component is scraped.
The decoupled scraping feature reduces the number of API requests sent to AWS. This feature also prevents component scrape timeouts when you gather high volumes of CloudWatch metrics.
Exported fields
The following fields are exported and can be referenced by other components.
For example, the targets can either be passed to a discovery.relabel component to rewrite the targets’ label sets or to a prometheus.scrape component that collects the exposed metrics.
The exported targets use the configured in-memory traffic address specified by the run command.
Component health
prometheus.exporter.cloudwatch is only reported as unhealthy if given
an invalid configuration. In those cases, exported fields retain their last
healthy values.
Debug information
prometheus.exporter.cloudwatch does not expose any component-specific
debug information.
Debug metrics
prometheus.exporter.cloudwatch does not expose any component-specific
debug metrics.
Example
See the examples described under each discovery and static sections.
Supported services in discovery jobs
The following is a list of AWS services that are supported in cloudwatch_exporter discovery jobs. When configuring a
discovery job, the type field of each discovery_job must match either the desired job namespace or alias.
- Namespace:
CWAgentor Alias:cwagent - Namespace:
AWS/Usageor Alias:usage - Namespace:
AWS/CertificateManageror Alias:acm - Namespace:
AWS/ACMPrivateCAor Alias:acm-pca - Namespace:
AmazonMWAAor Alias:airflow - Namespace:
AWS/MWAAor Alias:mwaa - Namespace:
AWS/ApplicationELBor Alias:alb - Namespace:
AWS/AppStreamor Alias:appstream - Namespace:
AWS/Backupor Alias:backup - Namespace:
AWS/ApiGatewayor Alias:apigateway - Namespace:
AWS/AmazonMQor Alias:mq - Namespace:
AWS/AppSyncor Alias:appsync - Namespace:
AWS/Athenaor Alias:athena - Namespace:
AWS/AutoScalingor Alias:asg - Namespace:
AWS/ElasticBeanstalkor Alias:beanstalk - Namespace:
AWS/Billingor Alias:billing - Namespace:
AWS/Cassandraor Alias:cassandra - Namespace:
AWS/CloudFrontor Alias:cloudfront - Namespace:
AWS/Cognitoor Alias:cognito-idp - Namespace:
AWS/DMSor Alias:dms - Namespace:
AWS/DDoSProtectionor Alias:shield - Namespace:
AWS/DocDBor Alias:docdb - Namespace:
AWS/DXor Alias:dx - Namespace:
AWS/DynamoDBor Alias:dynamodb - Namespace:
AWS/EBSor Alias:ebs - Namespace:
AWS/ElastiCacheor Alias:ec - Namespace:
AWS/MemoryDBor Alias:memorydb - Namespace:
AWS/EC2or Alias:ec2 - Namespace:
AWS/EC2Spotor Alias:ec2Spot - Namespace:
AWS/ECSor Alias:ecs-svc - Namespace:
ECS/ContainerInsightsor Alias:ecs-containerinsights - Namespace:
AWS/EFSor Alias:efs - Namespace:
AWS/ELBor Alias:elb - Namespace:
AWS/ElasticMapReduceor Alias:emr - Namespace:
AWS/EMRServerlessor Alias:emr-serverless - Namespace:
AWS/ESor Alias:es - Namespace:
AWS/Firehoseor Alias:firehose - Namespace:
AWS/FSxor Alias:fsx - Namespace:
AWS/GameLiftor Alias:gamelift - Namespace:
AWS/GlobalAcceleratoror Alias:ga - Namespace:
Glueor Alias:glue - Namespace:
AWS/IoTor Alias:iot - Namespace:
AWS/Kafkaor Alias:kafka - Namespace:
AWS/KafkaConnector Alias:kafkaconnect - Namespace:
AWS/Kinesisor Alias:kinesis - Namespace:
AWS/KinesisAnalyticsor Alias:kinesis-analytics - Namespace:
AWS/Lambdaor Alias:lambda - Namespace:
AWS/MediaConnector Alias:mediaconnect - Namespace:
AWS/MediaConvertor Alias:mediaconvert - Namespace:
AWS/MediaLiveor Alias:medialive - Namespace:
AWS/MediaTailoror Alias:mediatailor - Namespace:
AWS/Neptuneor Alias:neptune - Namespace:
AWS/NetworkFirewallor Alias:nfw - Namespace:
AWS/NATGatewayor Alias:ngw - Namespace:
AWS/NetworkELBor Alias:nlb - Namespace:
AWS/PrivateLinkEndpointsor Alias:vpc-endpoint - Namespace:
AWS/PrivateLinkServicesor Alias:vpc-endpoint-service - Namespace:
AWS/Prometheusor Alias:amp - Namespace:
AWS/QLDBor Alias:qldb - Namespace:
AWS/RDSor Alias:rds - Namespace:
AWS/Redshiftor Alias:redshift - Namespace:
AWS/Route53Resolveror Alias:route53-resolver - Namespace:
AWS/Route53or Alias:route53 - Namespace:
AWS/S3or Alias:s3 - Namespace:
AWS/SESor Alias:ses - Namespace:
AWS/Statesor Alias:sfn - Namespace:
AWS/SNSor Alias:sns - Namespace:
AWS/SQSor Alias:sqs - Namespace:
AWS/StorageGatewayor Alias:storagegateway - Namespace:
AWS/TransitGatewayor Alias:tgw - Namespace:
AWS/TrustedAdvisoror Alias:trustedadvisor - Namespace:
AWS/VPNor Alias:vpn - Namespace:
AWS/ClientVPNor Alias:clientvpn - Namespace:
AWS/WAFV2or Alias:wafv2 - Namespace:
AWS/WorkSpacesor Alias:workspaces - Namespace:
AWS/AOSSor Alias:aoss - Namespace:
AWS/SageMakeror Alias:sagemaker - Namespace:
/aws/sagemaker/Endpointsor Alias:sagemaker-endpoints - Namespace:
/aws/sagemaker/TrainingJobsor Alias:sagemaker-training - Namespace:
/aws/sagemaker/ProcessingJobsor Alias:sagemaker-processing - Namespace:
/aws/sagemaker/TransformJobsor Alias:sagemaker-transform - Namespace:
/aws/sagemaker/InferenceRecommendationsJobsor Alias:sagemaker-inf-rec - Namespace:
AWS/Sagemaker/ModelBuildingPipelineor Alias:sagemaker-model-building-pipeline
Compatible components
prometheus.exporter.cloudwatch has exports that can be consumed by the following components:
- Components that consume Targets
Note
Connecting some components may not be sensible or components may require further configuration to make the connection work correctly. Refer to the linked documentation for more details.


