Use logs to debug your extension point
info
This feature is only available when running Grafana in development mode.
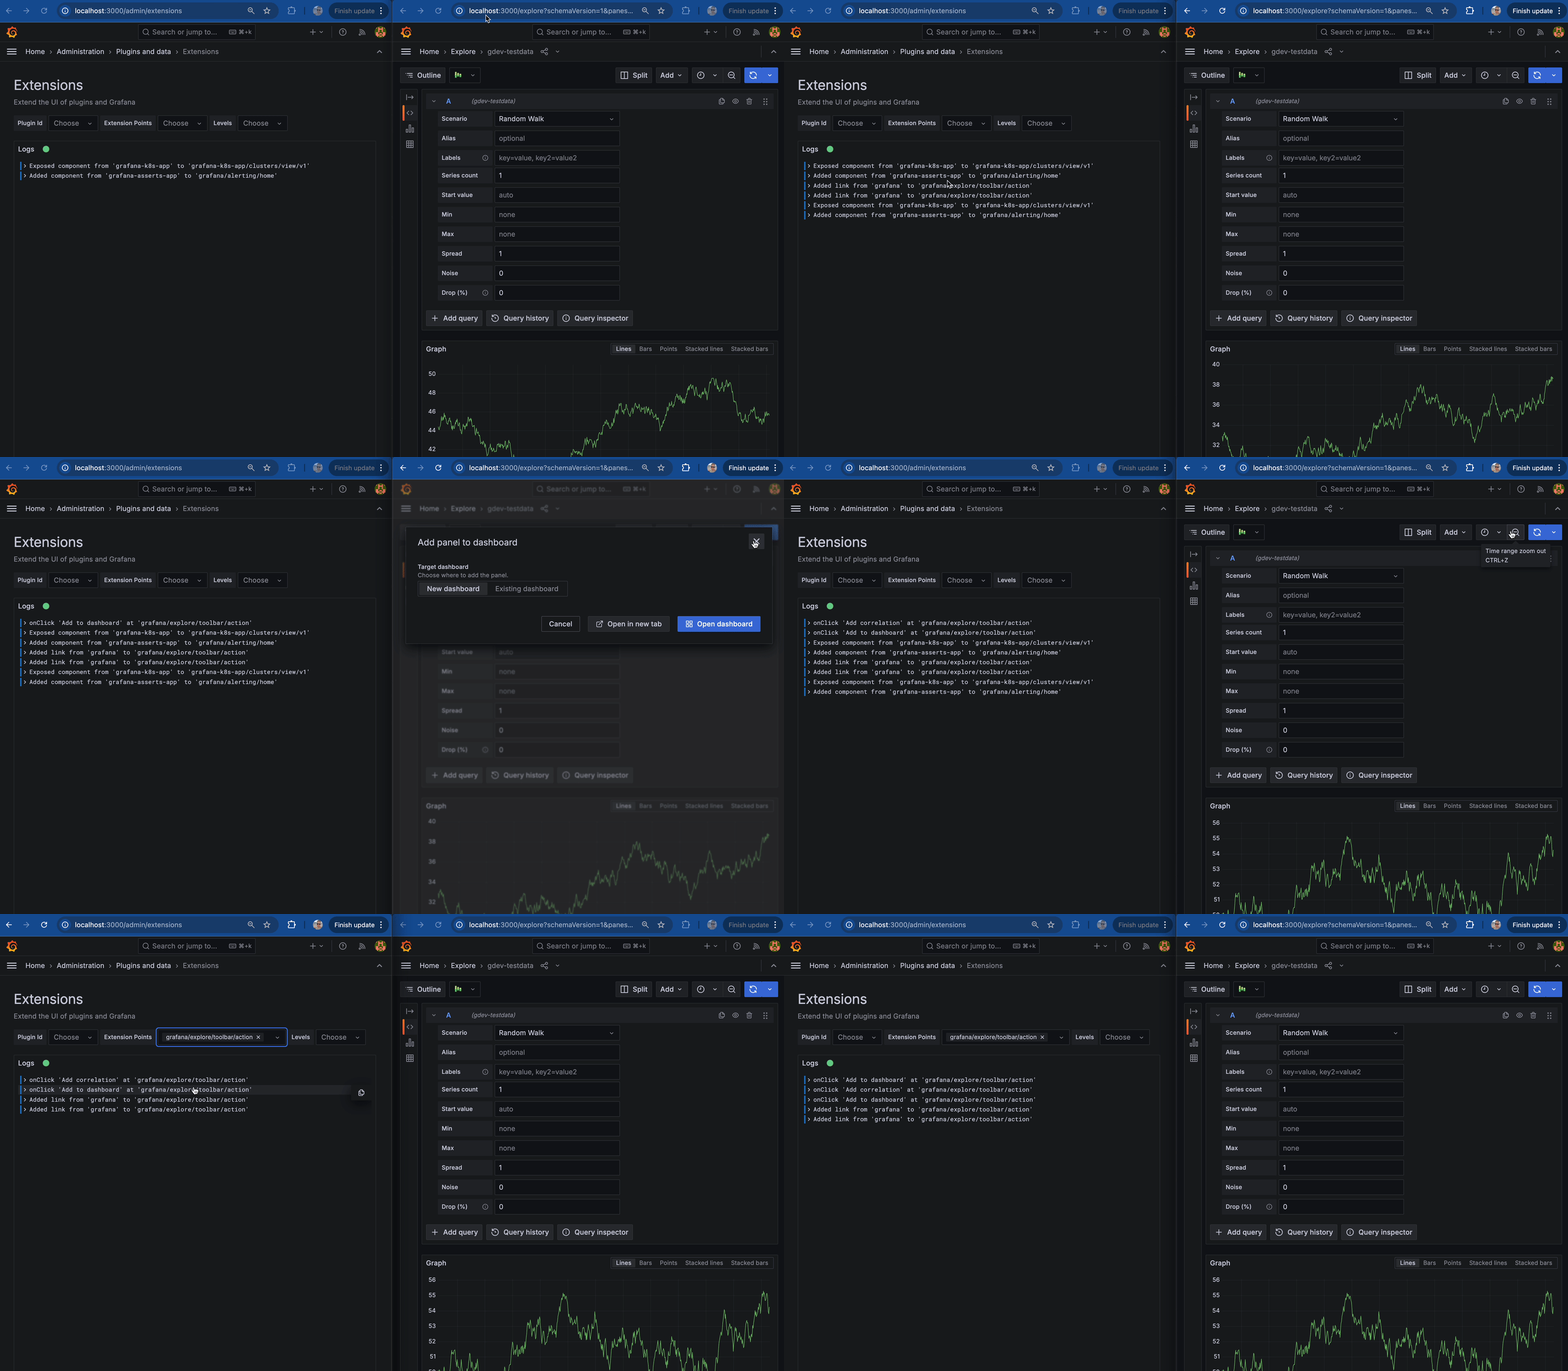
The Extensions log view is an admin page that displays all the logs collected by Grafana while you're developing your extension point.
To access it, go to Grafana > Administration > Plugins and data > Extensions while working in development mode to see the logs of all the tabs active in your browser. This way you can easily open the extensions log view in one browser or tab and debug your extensions in another tab.
