Add Visualization Suggestions to panel plugins
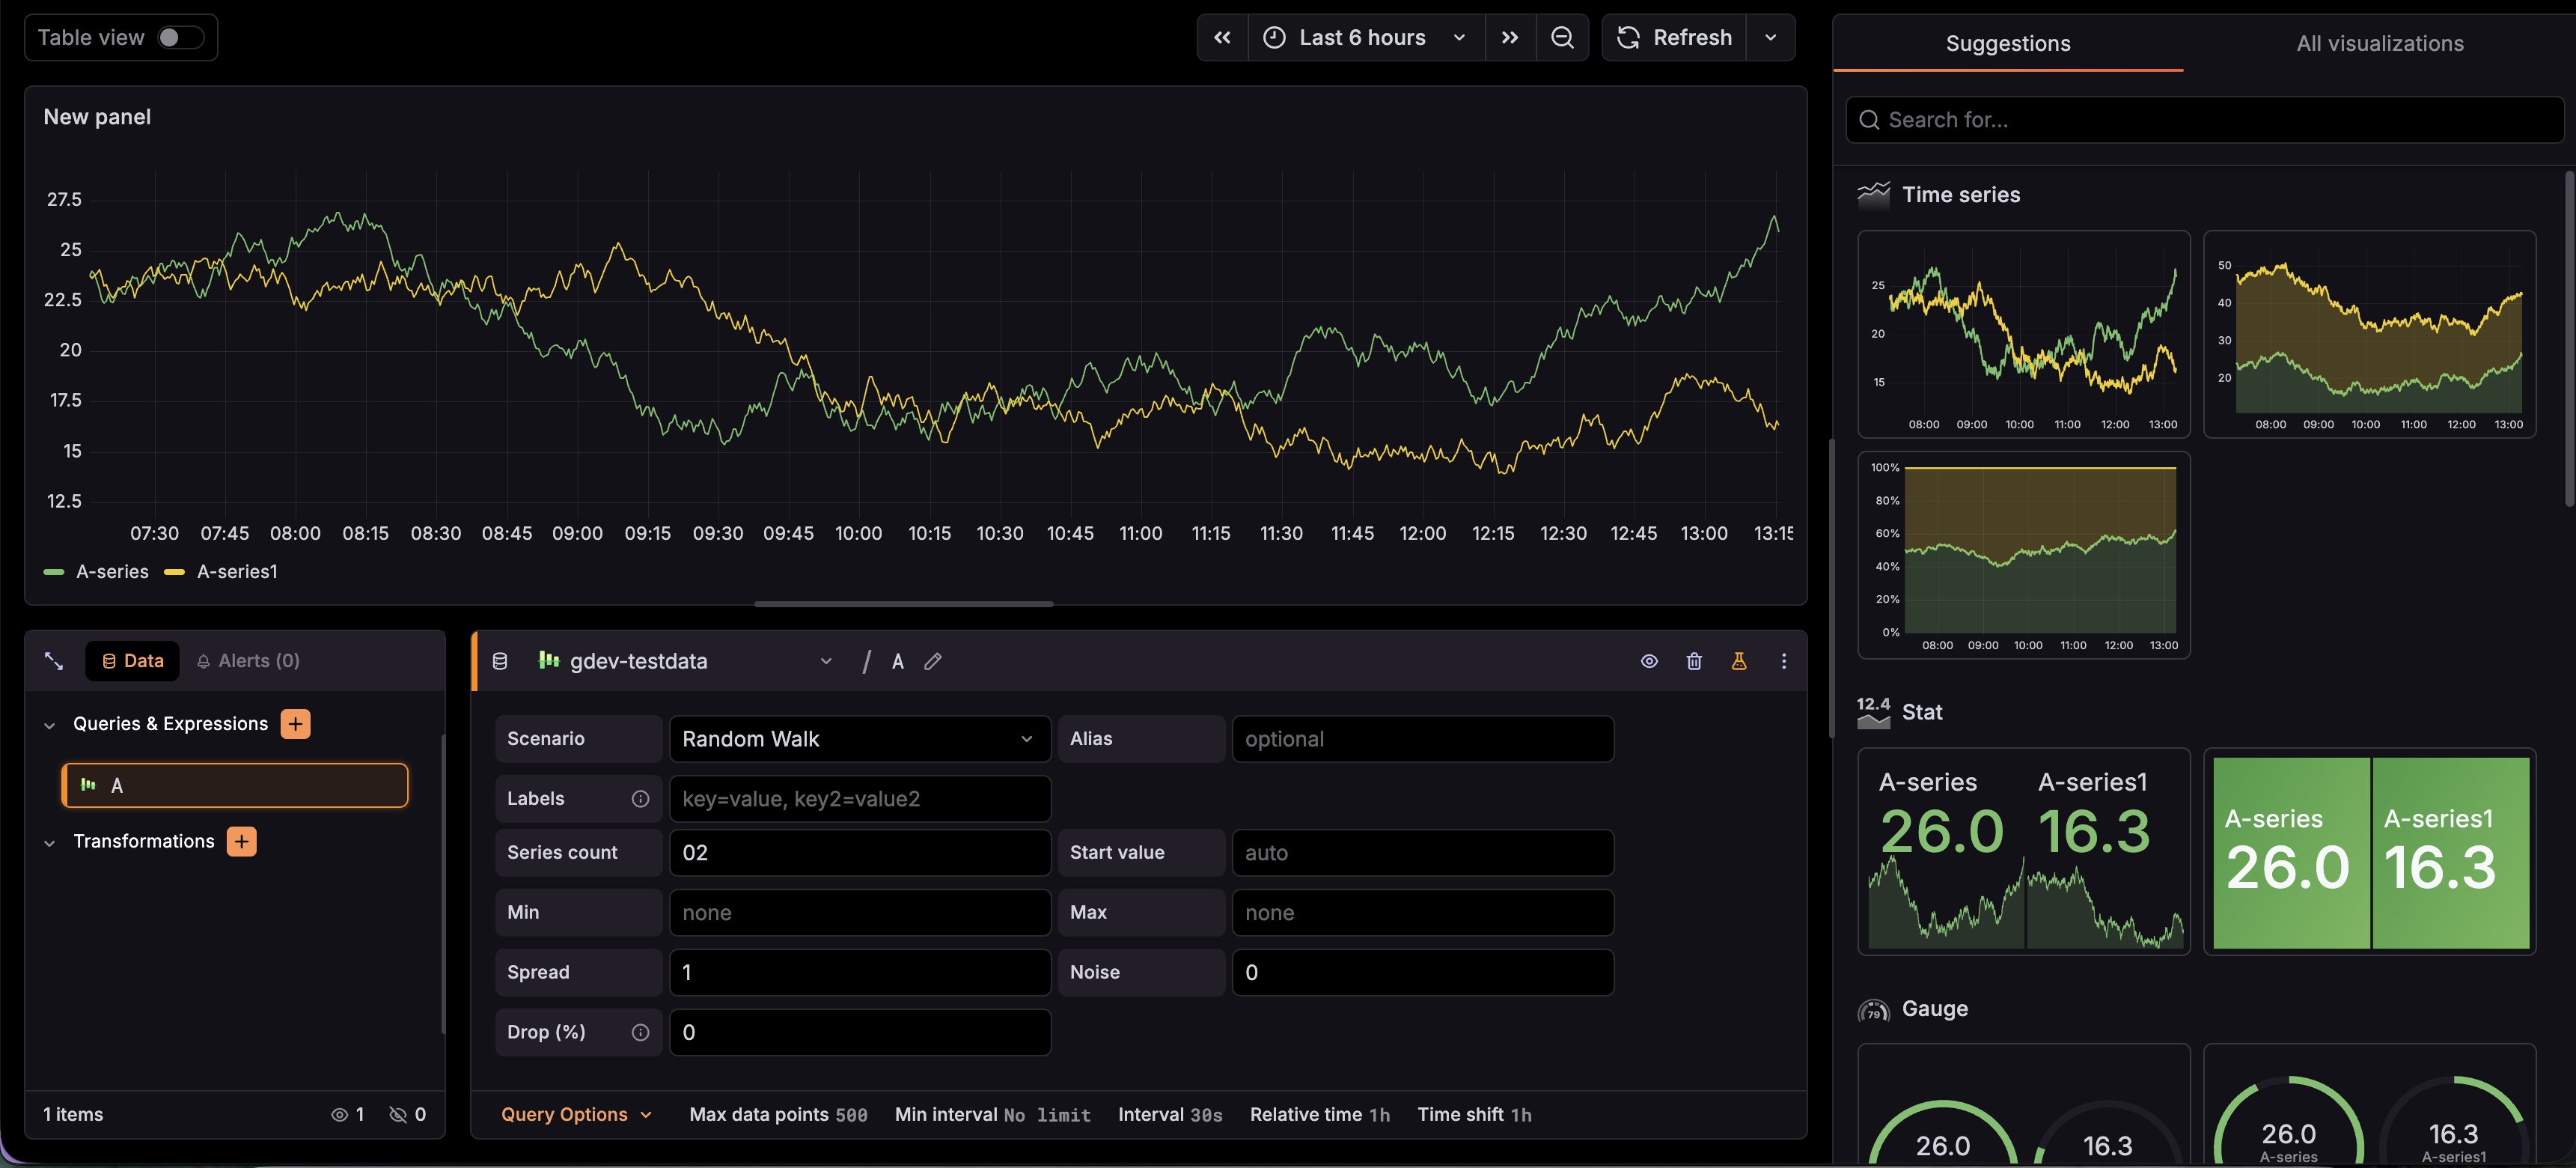
Grafana's Visualization Suggestions feature shows users a ranked list of panel types that are suitable for their current data. In Grafana 13, Visualization Suggestions became the default way to select a visualization type in the visualization picker, and we opened up the ability for external plugins to provide their own Visualization Suggestions. This guide explains how to implement Visualization Suggestions for your external panel plugin so it appears in that list.
Prerequisites
- Basic knowledge of Grafana panel plugin development
- Familiarity with TypeScript
- A panel plugin with a
module.tsentry point
How Suggestions work
When a user opens the visualization picker, Grafana calls each panel plugin's Suggestions supplier with a summary of the current panel data. Each plugin returns the VisualizationSuggestion objects (if any) describing how to configure the plugin for that data. Grafana then ranks all Suggestions and presents them to the user.
Ranking order
Suggestions are sorted by the following priority:
- Core plugins always rank above external plugins, regardless of score. An external plugin with a score of
Bestwill appear below a core plugin with a score ofOK. - Within each tier (core or external), suggestions are sorted by score in descending order.
- Within the same tier and score, suggestions that match the data's
preferredVisualisationTyperank higher.
Return an accurate score so your plugin surfaces correctly relative to other external plugins when the data is a good fit.
The suggestions field in plugin.json
To opt your plugin in to the Suggestions system, set "suggestions": true in your plugin.json:
{
  "type": "panel",
  "name": "My Panel",
  "id": "myorg-mypanel-panel",
  "suggestions": true
}
Without this field, Grafana will not call your supplier.
Set up the supplier
Call setSuggestionsSupplier on your PanelPlugin instance in module.ts. The supplier is a function that receives a PanelDataSummary and returns an array of VisualizationSuggestion objects, or void (no suggestions):
import { PanelPlugin } from '@grafana/data';
import { MyPanel } from './MyPanel';
import { MyPanelOptions } from './types';

export const plugin = new PanelPlugin<MyPanelOptions>(MyPanel).setSuggestionsSupplier((dataSummary) => {
  // Return void (or nothing) when your plugin cannot meaningfully
  // visualize this data.
  if (!dataSummary.hasData) {
    return;
  }

  return [
    {
      name: 'My panel',
    },
  ];
});
Understand PanelDataSummary
The PanelDataSummary object gives you a pre-computed summary of the current data frames. Use the summary methods and attributes over rawFrames — they are faster and cover the most common cases:
| API | Description |
|---|---|
hasData | true when there is at least one row of data |
frameCount | Number of data frames |
rowCountTotal | Total rows across all frames |
rowCountMax | Maximum rows in any single frame |
fieldCount | Total fields across all frames |
fieldCountMax | Maximum fields in any single frame |
isInstant | true when all time values are the same (snapshot queries) |
hasFieldType(FieldType) | true if any field matches the given type |
fieldCountByType(FieldType) | Count of fields matching the given type across all frames |
hasDataFrameType(DataFrameType) | true if any frame has the given meta.type |
hasPreferredVisualisationType(PreferredVisualisationType) | true if any frame declares a preferred viz type |
rawFrames | Direct access to the raw DataFrame array for deep inspection |
Use rawFrames only when you need to inspect field names, custom metadata, or other details that the summary methods do not cover. The summary methods are computed once when the data changes and are much cheaper to call repeatedly.
Simple case: a single suggestion
If your panel has a narrow data requirement (for example, it only works with a specific frame format), return a single suggestion when the data matches, and void otherwise.
This is the pattern used by the Flame Graph panel. It inspects rawFrames to check for required fields because it needs to validate field-level metadata:
import { PanelPlugin, DataFrame, FieldType } from '@grafana/data';

import { MyPanel } from './MyPanel';
import { MyPanelOptions } from './types';

function isValidData(frames: DataFrame[]): boolean {
  // Check for a required field by name or type
  return frames.some((frame) =>
    frame.fields.some((field) => field.name === 'level' && field.type === FieldType.number)
  );
}

export const plugin = new PanelPlugin<MyPanelOptions>(MyPanel).setSuggestionsSupplier((dataSummary) => {
  // Use rawFrames only when you need field-level inspection
  if (!dataSummary.rawFrames || !isValidData(dataSummary.rawFrames)) {
    return;
  }

  return [
    {
      name: 'My panel',
    },
  ];
});
When you omit name, options, score, and fieldConfig, Grafana fills them in from the plugin's own defaults. A single {} entry is valid for the simplest possible suggestion.
Complex case: multiple suggestions with scoring
If your panel supports multiple visualization variants (for example, line chart, bar chart, stacked area), return one suggestion per variant and assign a score based on how well the data fits.
This is the pattern used by the Time series panel:
import {
  DataFrameType,
  FieldType,
  VisualizationSuggestionScore,
  VisualizationSuggestionsSupplier,
} from '@grafana/data';
import { MyPanelOptions, MyFieldConfig, GraphDrawStyle } from './types';

export const mySuggestionsSupplier: VisualizationSuggestionsSupplier<MyPanelOptions, MyFieldConfig> = (dataSummary) => {
  // Guard: this plugin requires time + number fields and more than one row
  if (
    !dataSummary.hasFieldType(FieldType.time) ||
    !dataSummary.hasFieldType(FieldType.number) ||
    dataSummary.rowCountTotal < 2
  ) {
    return;
  }

  // Don't suggest this panel for instant (snapshot) queries
  if (dataSummary.isInstant) {
    return;
  }

  // Score higher when the data explicitly declares itself as a time series type
  const score: VisualizationSuggestionScore =
    dataSummary.hasDataFrameType(DataFrameType.TimeSeriesWide) ||
    dataSummary.hasDataFrameType(DataFrameType.TimeSeriesLong)
      ? VisualizationSuggestionScore.Good
      : VisualizationSuggestionScore.OK;

  const suggestions = [
    {
      name: 'Line chart',
      fieldConfig: {
        defaults: { custom: { drawStyle: GraphDrawStyle.Line, lineWidth: 1 } },
        overrides: [],
      },
    },
    {
      name: 'Bar chart',
      options: {
        custom: {
          foo: true,
        },
      },
      fieldConfig: {
        defaults: { custom: { drawStyle: GraphDrawStyle.Bars } },
        overrides: [],
      },
    },
  ];

  // Apply score to all suggestions (score is only used if not already set on the suggestion)
  return suggestions.map((s) => ({ score, ...s }));
};
Then wire the supplier into module.ts:
import { PanelPlugin } from '@grafana/data';
import { MyPanel } from './MyPanel';
import { MyPanelOptions } from './types';
import { mySuggestionsSupplier } from './suggestions';

export const plugin = new PanelPlugin<MyPanelOptions>(MyPanel).setSuggestionsSupplier(mySuggestionsSupplier);
Splitting the supplier into its own file keeps module.ts clean and makes the supplier independently testable.
Suggestion scores
Use the VisualizationSuggestionScore enum to communicate how well your plugin fits the data:
| Score constant | When to use |
|---|---|
VisualizationSuggestionScore.Best | Your plugin is definitively the best option for this data |
VisualizationSuggestionScore.Good | Your plugin is a strong match but not the only sensible choice |
VisualizationSuggestionScore.OK | Your plugin can display this data, but other options may suit it better |
If you do not set a score, Grafana defaults to OK. It is fine to omit the score unless you have a specific reason to rank a suggestion higher or lower.
Customize the suggestion card with cardOptions
Suggestion preview cards render a live panel at a small size. The cardOptions object controls how the card looks and how much data it receives. Use it to keep preview cards fast and visually clear - especially important when users have large datasets.
Limit preview data with maxSeries and maxRows
Preview cards render a real panel instance, so passing a full dataset into a small thumbnail can cause slow rendering. Use maxSeries and maxRows to cap the data before it reaches the card renderer:
| Property | Type | Description |
|---|---|---|
maxSeries | number | Maximum number of data frames (series) passed to the preview |
maxRows | number | Maximum number of rows per data frame passed to the preview |
Pick limits based on what makes visual sense at preview scale. For example, a stat panel only needs a handful of series to convey its layout, while a bar chart benefits from capping rows to avoid rendering hundreds of thin bars:
// Stat panel: limit to 6 series for a clean preview
cardOptions: {
  maxSeries: 6,
  previewModifier: (s) => {
    if (s.options?.reduceOptions?.values) {
      s.options.reduceOptions.limit = 6;
    }
  },
},

// Bar chart: cap rows when the dataset is large
cardOptions: {
  maxRows: 20,
  previewModifier: (s) => {
    s.options!.legend = { showLegend: false };
  },
},
Adjust preview appearance with previewModifier
The previewModifier function lets you adjust how a suggestion looks in the preview card. It is called just before the card is rendered, and you should mutate the suggestion object directly:
cardOptions: {
  previewModifier: (s) => {
    // Common adjustments for preview cards:
    // - Hide the legend (takes space, not useful at small scale)
    // - Increase line widths (thin lines disappear at preview scale)
    // - Disable keyboard/hover events
    // - Force a simpler view mode
    s.options = s.options ?? {};
    s.options.legend = { showLegend: false };
  },
},
The previewModifier only affects how the card is rendered - it does not change what gets applied when the user selects the suggestion.
Test your supplier
Because the supplier is a plain function, you can test it directly to confirm its behavior:
import {
  createDataFrame,
  DataFrameType,
  FieldType,
  getPanelDataSummary,
  VisualizationSuggestionScore,
} from '@grafana/data';
import { mySuggestionsSupplier } from './suggestions';

describe('mySuggestionsSupplier', () => {
  it('returns void when there is no time field', () => {
    const result = mySuggestionsSupplier(
      getPanelDataSummary([
        createDataFrame({
          fields: [{ name: 'value', type: FieldType.number, values: [1, 2, 3] }],
        }),
      ])
    );
    expect(result).toBeUndefined();
  });

  it('returns suggestions for time + number data', () => {
    const result = mySuggestionsSupplier(
      getPanelDataSummary([
        createDataFrame({
          fields: [
            { name: 'time', type: FieldType.time, values: [0, 100, 200] },
            { name: 'value', type: FieldType.number, values: [1, 2, 3] },
          ],
        }),
      ])
    );
    expect(result).toHaveLength(2);
    expect(result![0].name).toBe('Line chart');
  });

  it('scores Good for explicit time series frame types', () => {
    const result = mySuggestionsSupplier(
      getPanelDataSummary([
        createDataFrame({
          meta: { type: DataFrameType.TimeSeriesWide },
          fields: [
            { name: 'time', type: FieldType.time, values: [0, 100, 200] },
            { name: 'value', type: FieldType.number, values: [1, 2, 3] },
          ],
        }),
      ])
    );
    expect(result![0].score).toBe(VisualizationSuggestionScore.Good);
  });
});
Notes
- Return
void(or nothing) from your supplier when the data is not a good fit for your panel plugin. Never return an empty array — it signals that you have looked at the data and decided no variant is suitable, but the outcome is the same asvoidwithout allocating an extra array. - The
namefield on a suggestion defaults to the plugin's display name fromplugin.json. Override it only when you are returning multiple suggestions that need distinct names. optionsandfieldConfigin a suggestion are merged with the plugin's defaults, so you should only include the fields you want to override within a suggestion.