Alertmanager
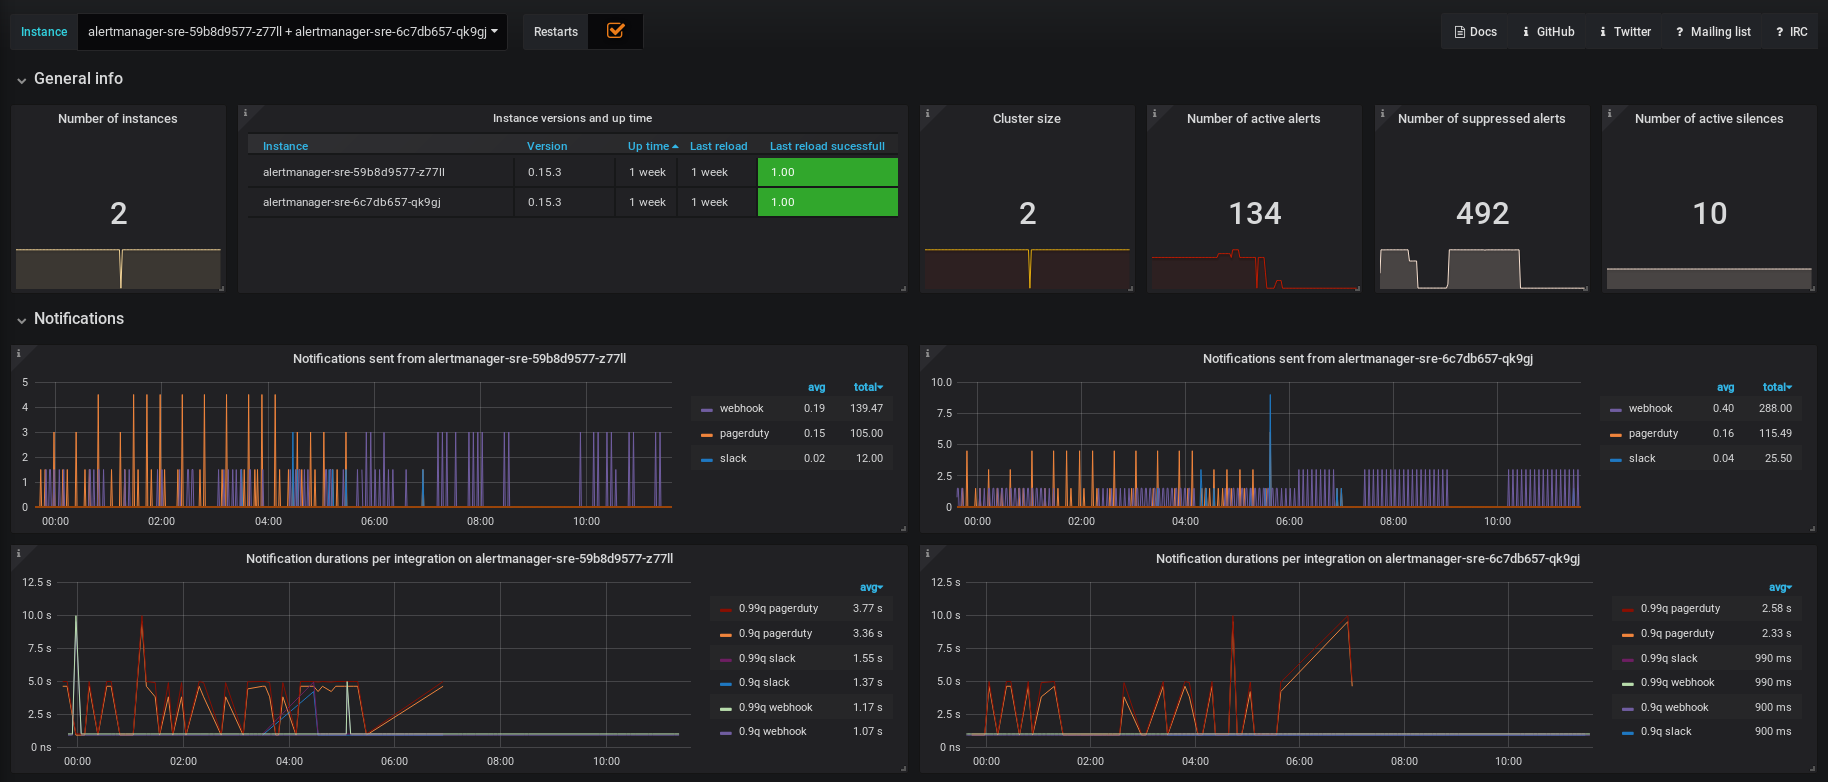
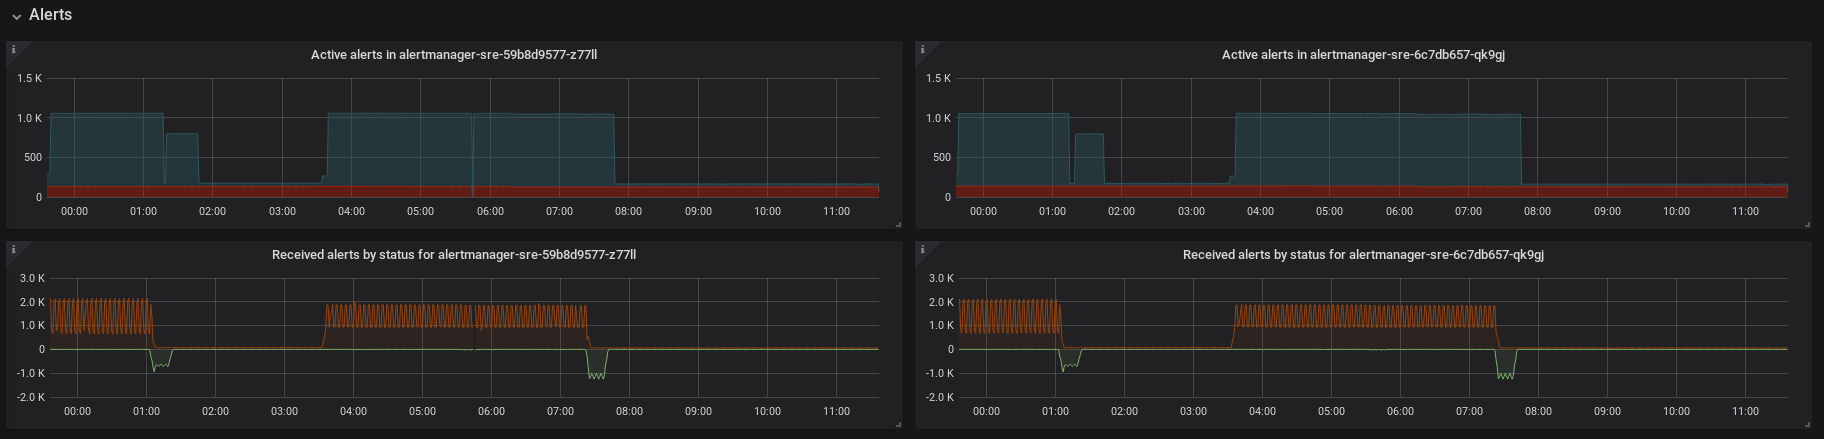
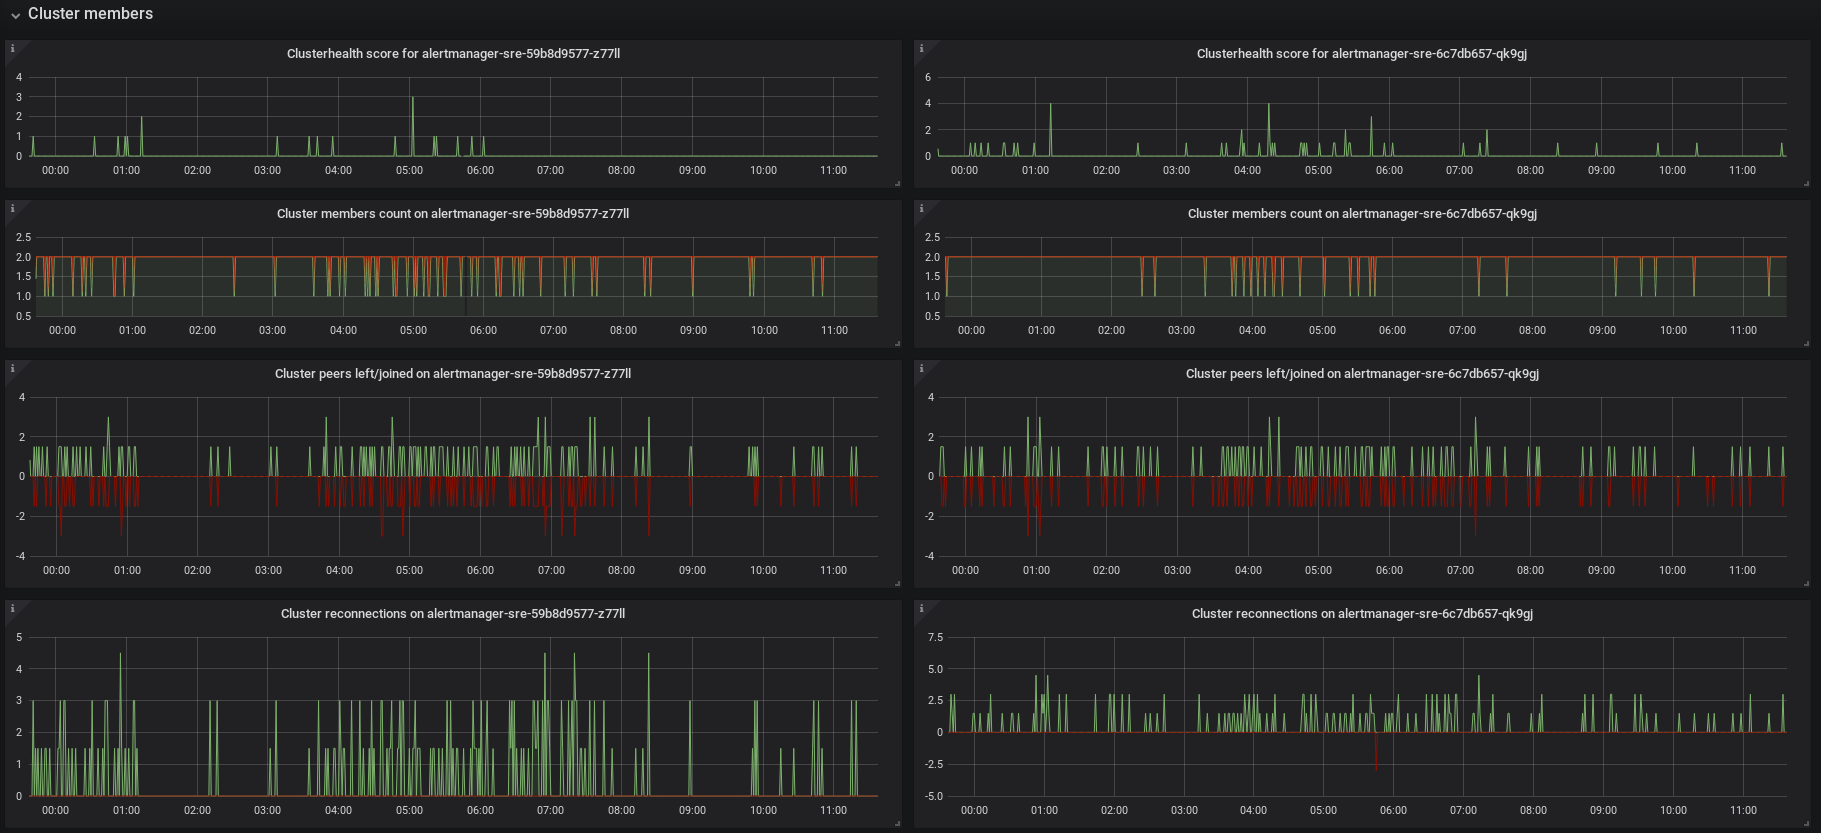
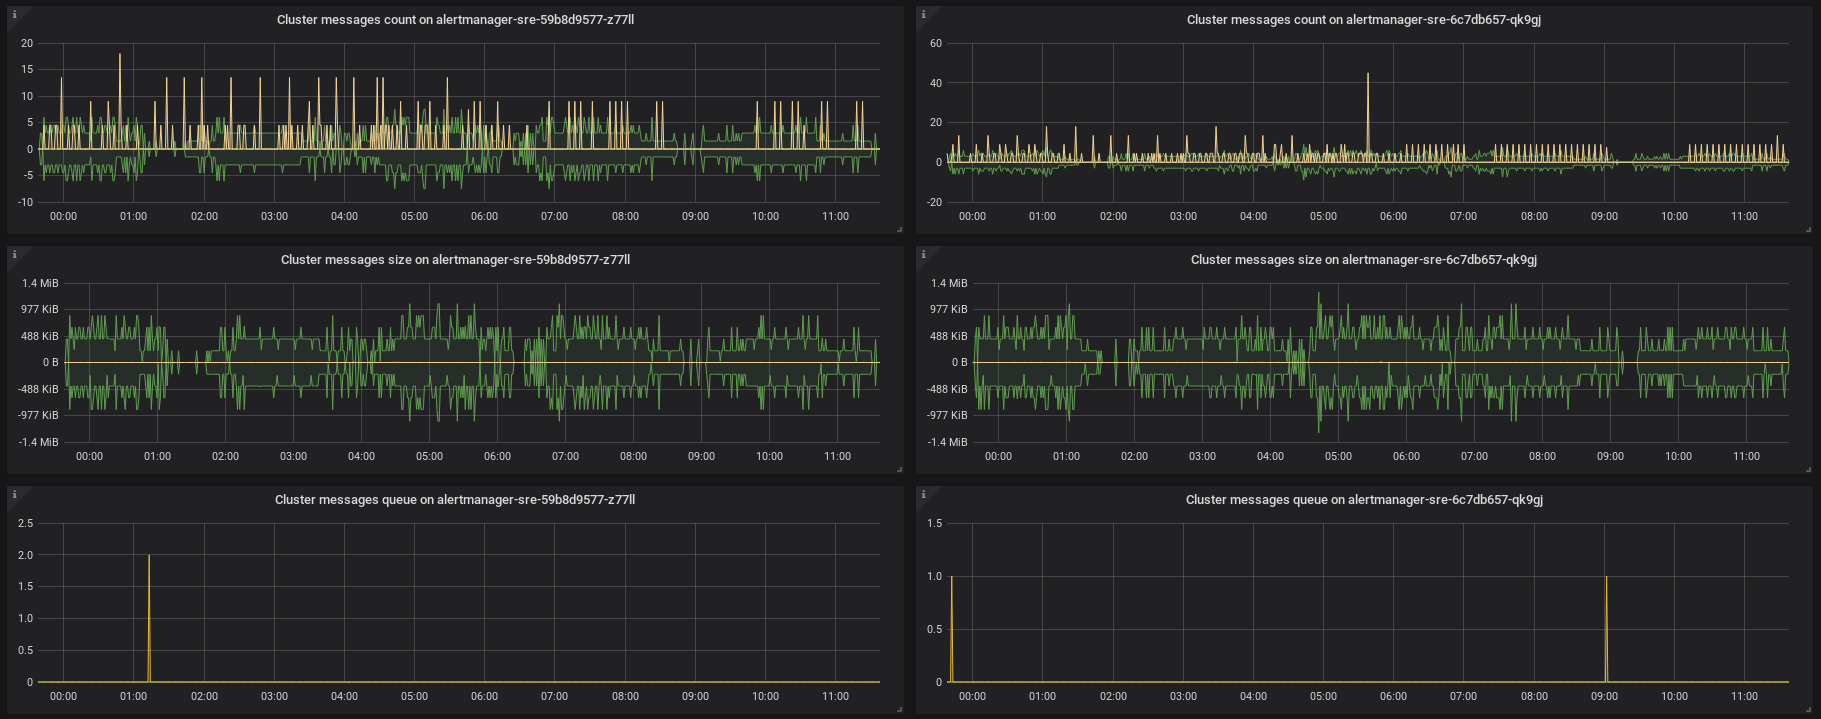
Dashboard showing Prometheus Alertmanager metrics for observing status of the cluster and possible debbuging.
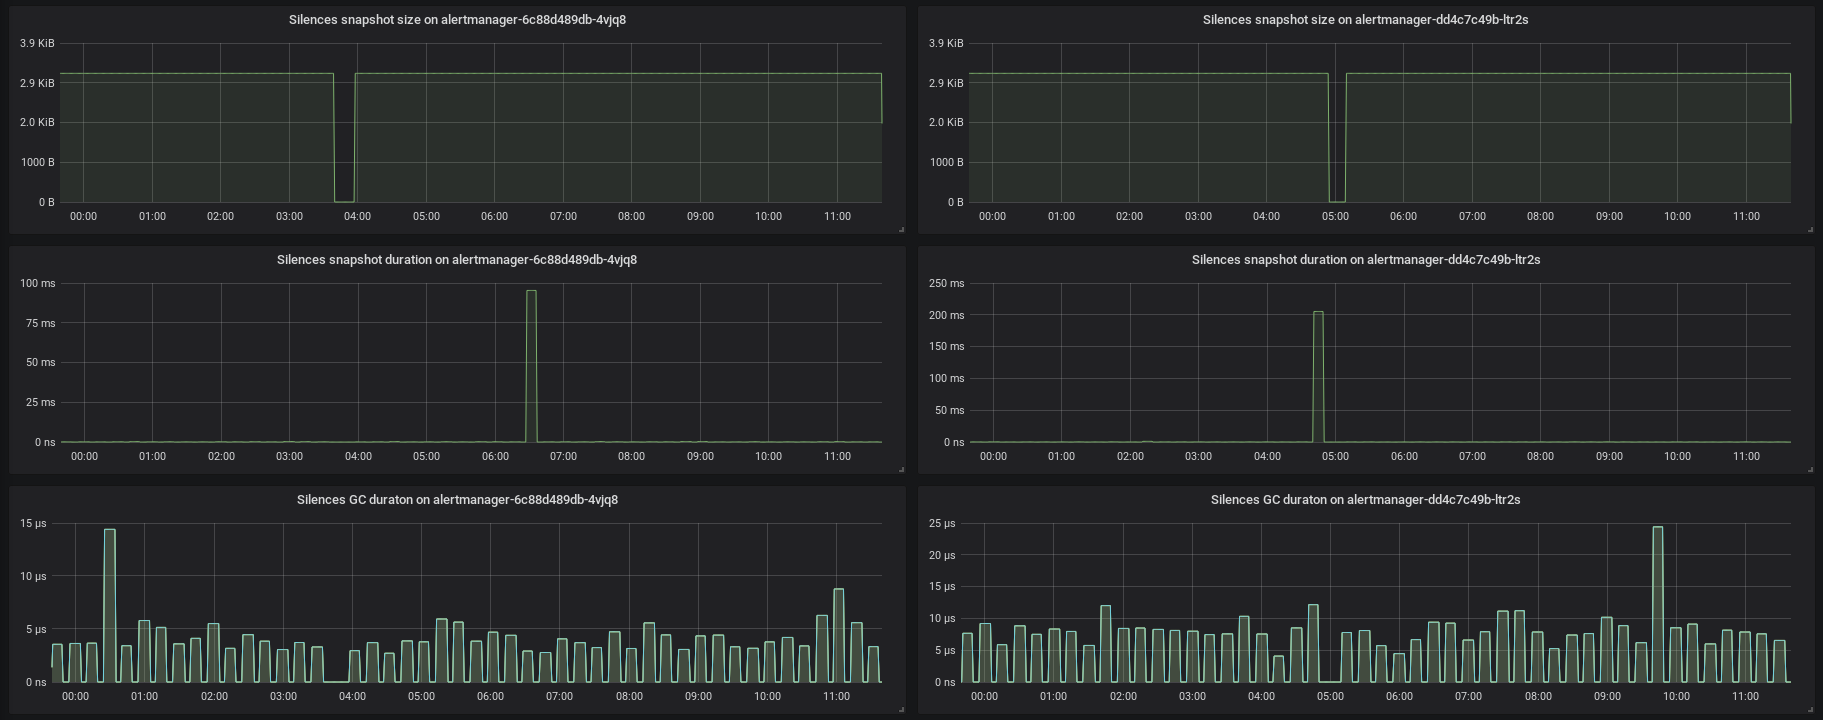
Alertmanager Grafana dashboard
I made this dashboard to get better glance what happens in our Alertmanager cluster and to ease debugging. Suprisingly I did not find any other publicly available. Feel free to use if and modify to suite your case.
GitHub: https://github.com/FUSAKLA/alertmanager-grafana-dashboard
Description
The dashboard uses Alertmanagers metrics exposed on the HTTP endpoint /metrics in Prometheus format.
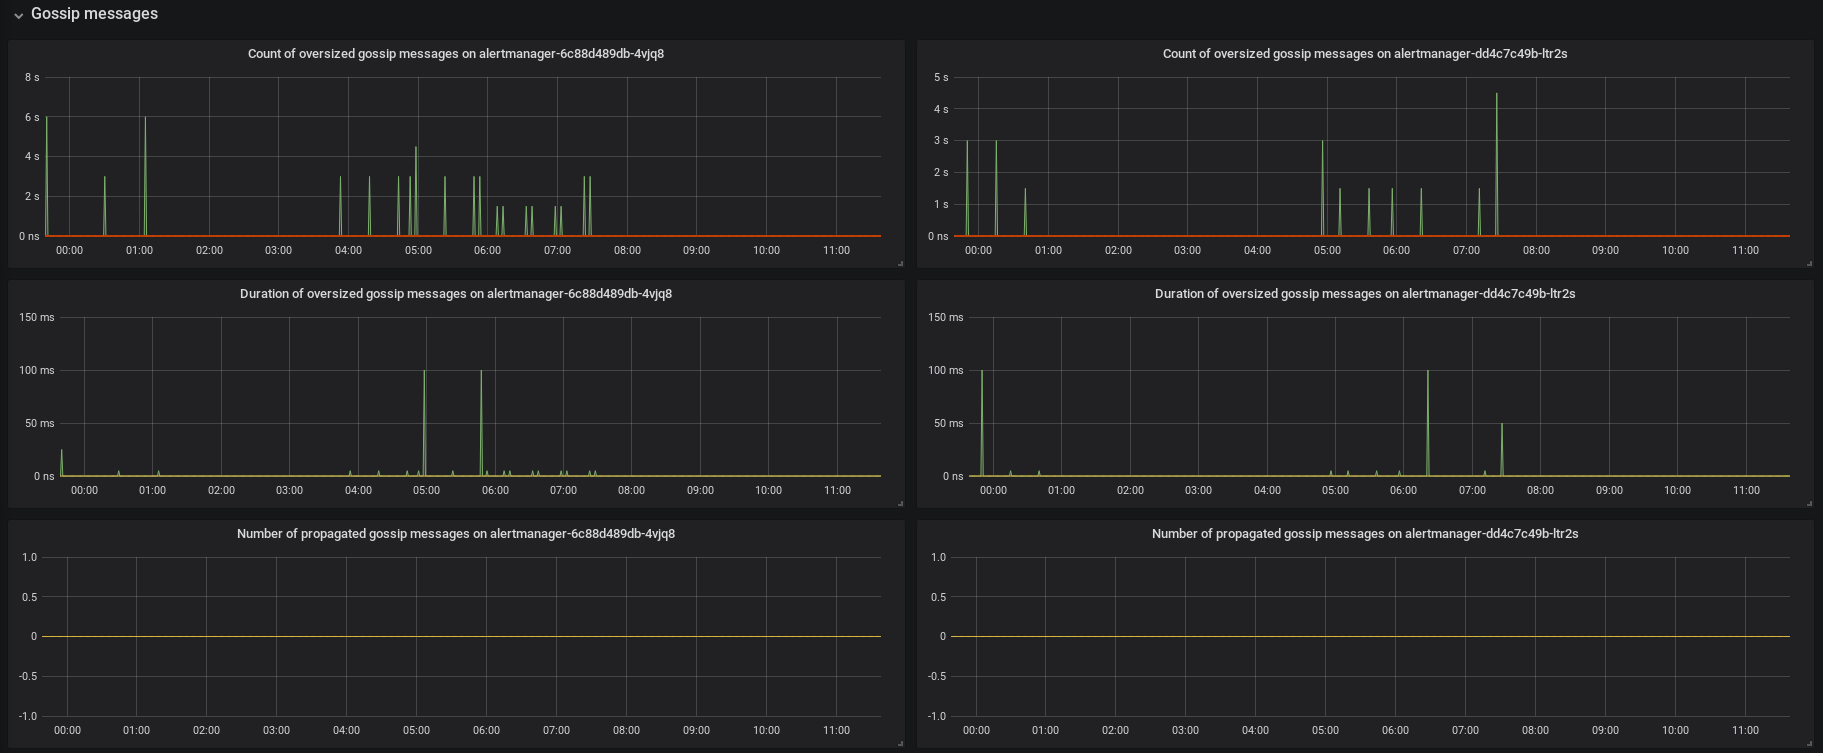
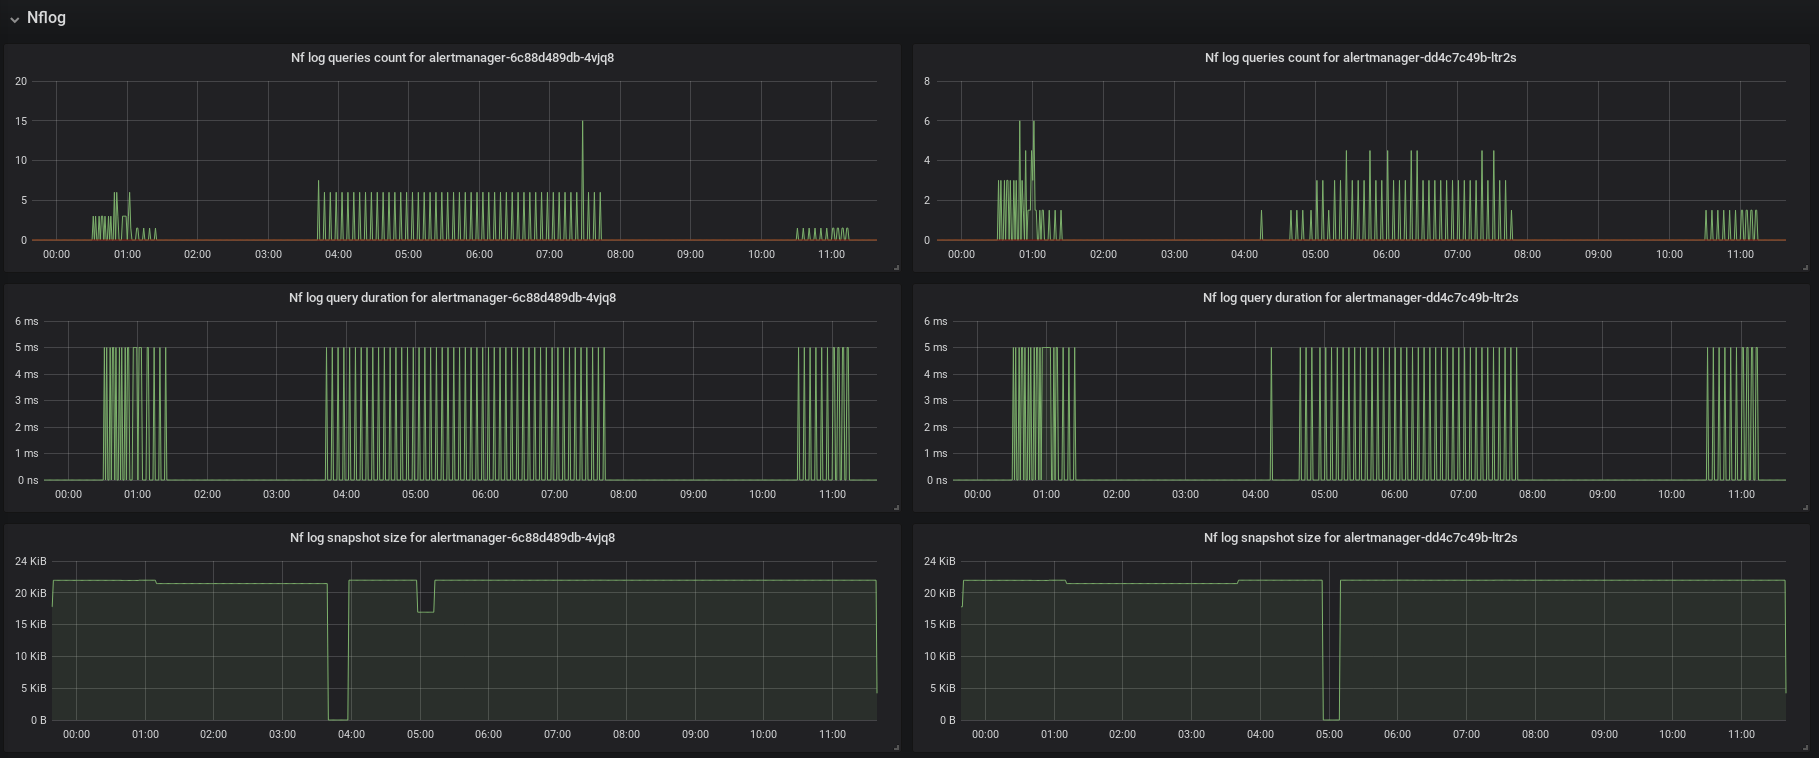
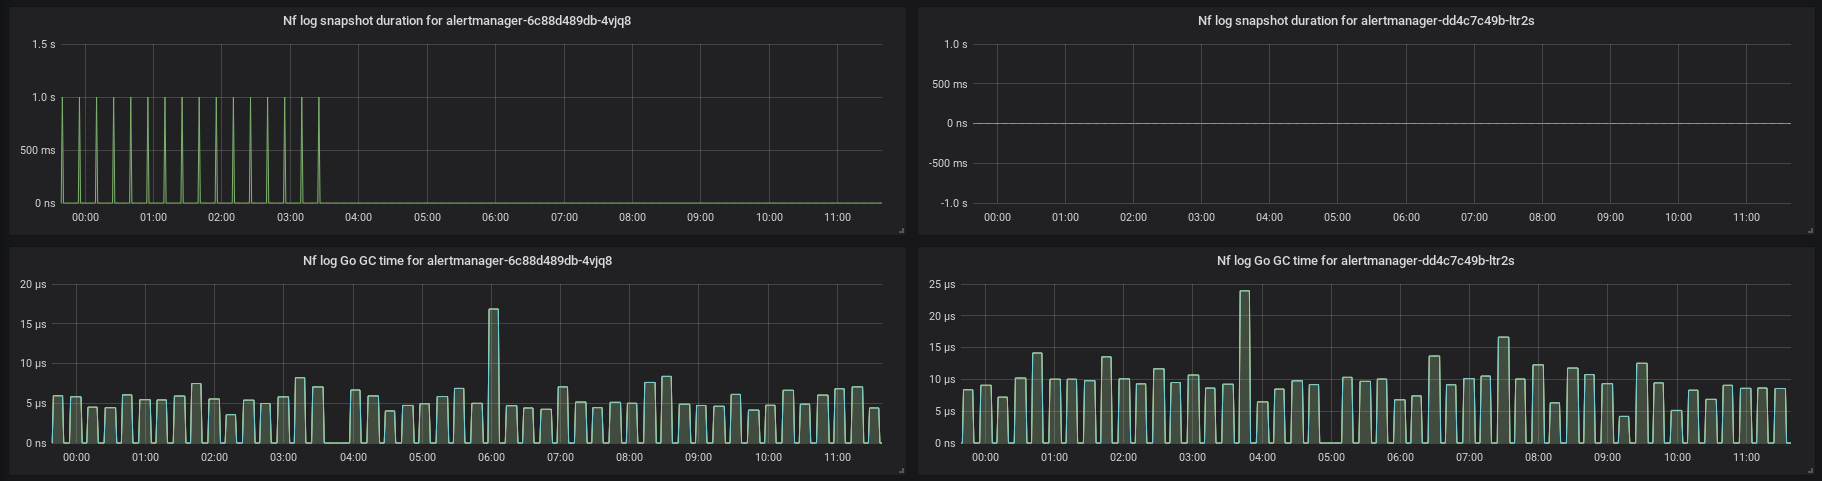
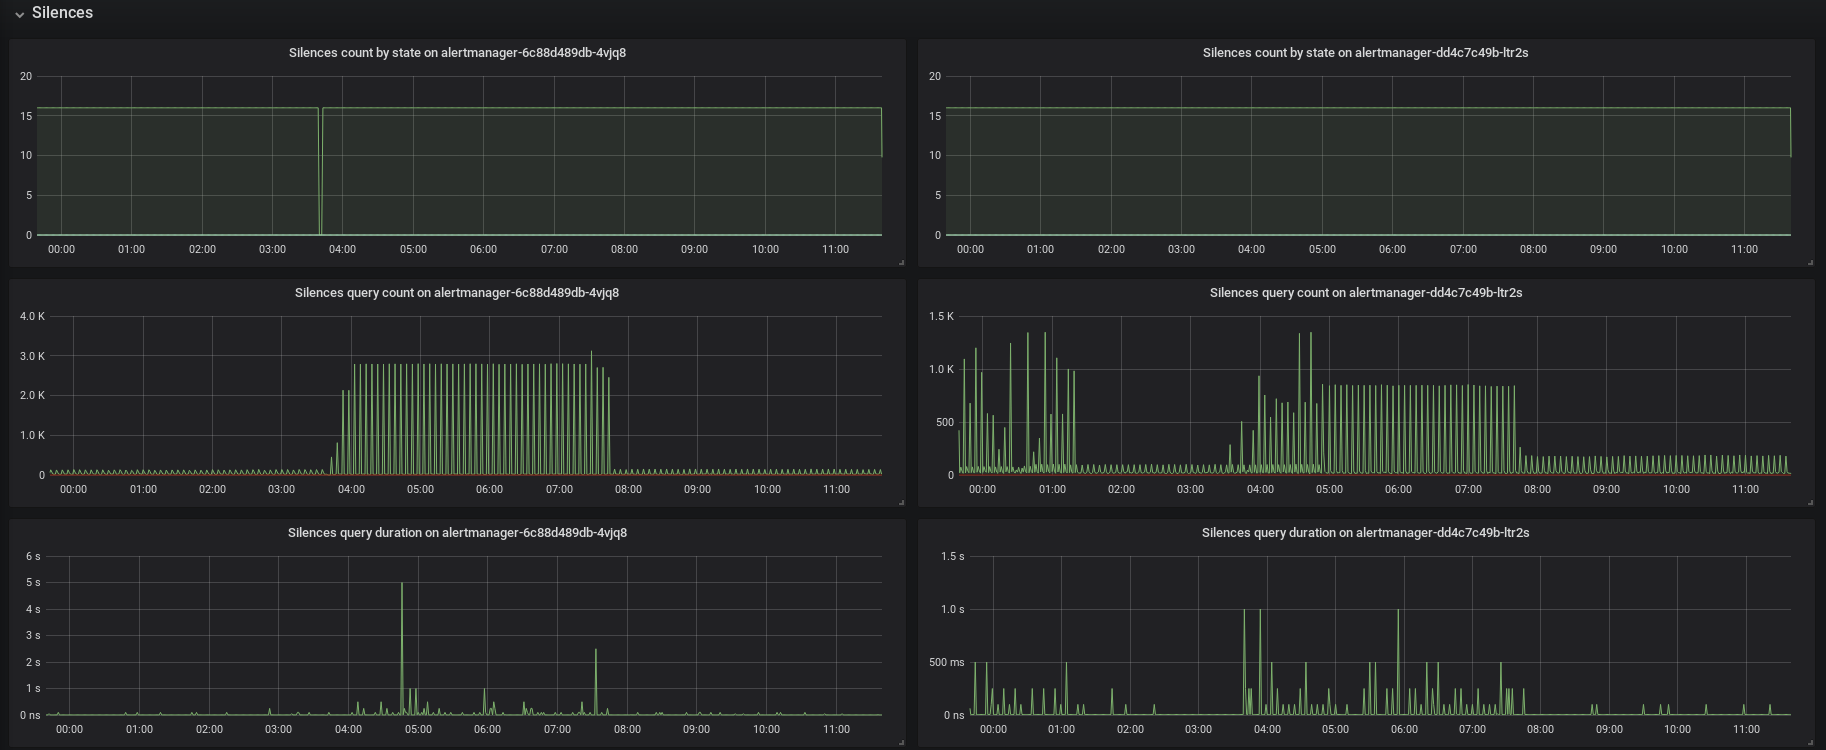
It should give you good idea about state of your Alertmanager cluster, it's utilization and health.
Dashboard works only with instance label and repeats all graphs for every instance found
in the metric alertmanager_build_info.
Every graph should have description tooltip on the upper left cornet if you hover over it.
Requirements
Datasource
- Prometheus datasource - datasource poiting to the prometheus instance which scrapes metrics of desired Alertmanager instances.
Installation
There are three ways to install this dashboard
- Copy the
JSONdefinition of dashboard and paste it in the Import dialog in Grafana - Download the
JSONdefinition and using theUpload .json filedialog - Load the dashboard directly form http://Grafana.com website using
dashboard ID
9578or on link https://grafana.com/dashboards/9578
Screenshots

Contributing
I'll be happy to add any reasonable feature you would appreciate so don't hesitate to create issue or PR directly.
Please if you make a PR add also screenshot of your change for easier CR. Thanks!
Credits
Thank's goes to maintainers of the Alertmanager! Great work and thanks :)
Data source config
Collector config:
Upload an updated version of an exported dashboard.json file from Grafana
| Revision | Description | Created | |
|---|---|---|---|
| Download |