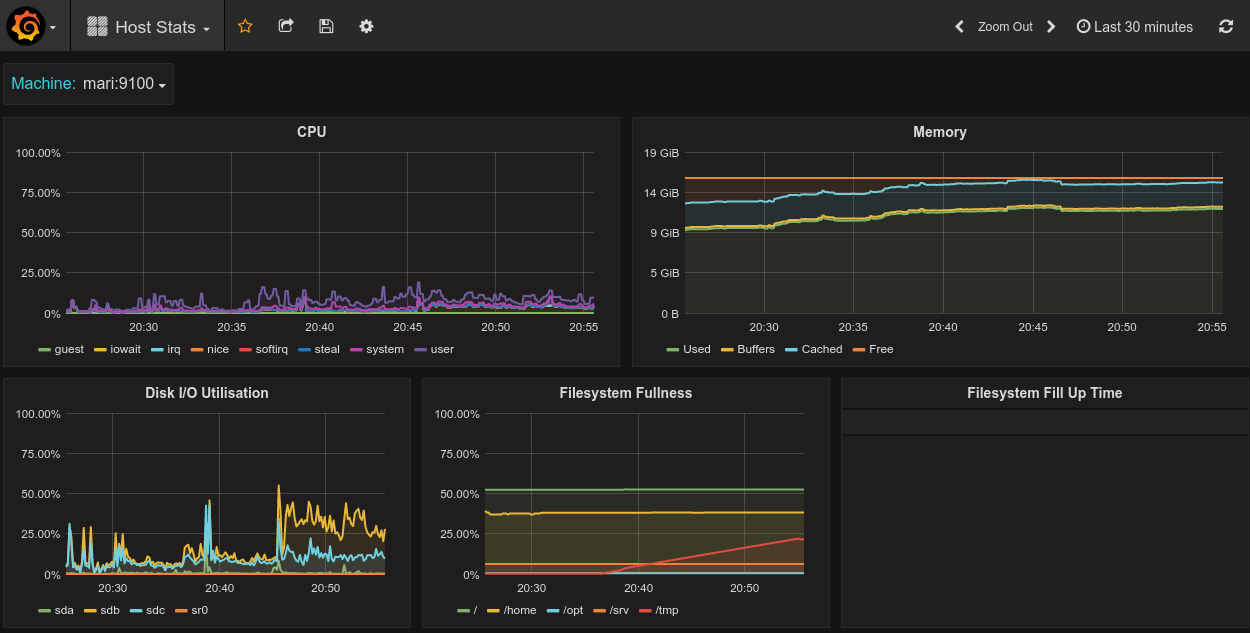
Host Stats - Prometheus Node Exporter - pre 0.16.0
Basic host stats: CPU, Memory Usage, Disk Utilisation, Filesystem usage and Predicted time to filesystems filling
Your node exporters should have the job label set to node in your prometheus.yml.
Data source config
Collector type:
Collector plugins:
Collector config:
Revisions
Upload an updated version of an exported dashboard.json file from Grafana
| Revision | Description | Created | |
|---|---|---|---|
| Download |
Linux Server
Monitor Linux with Grafana. Easily monitor your Linux deployment with Grafana Cloud's out-of-the-box monitoring solution.
Learn more