Node Dashboard
Batch of nearly all metrics values exported by Prometheus and Node Exporter.
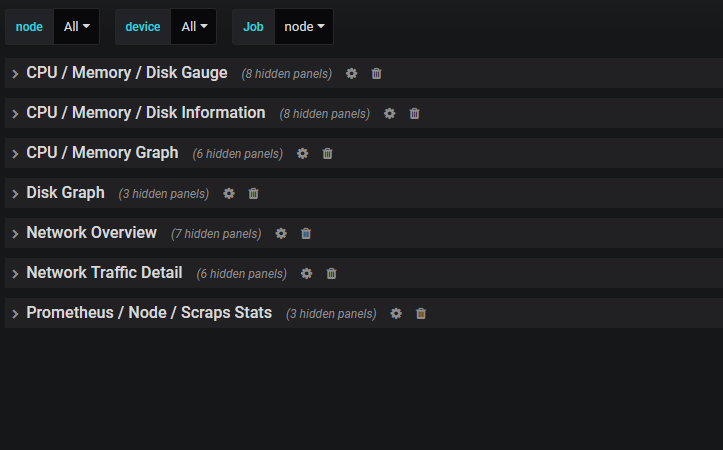
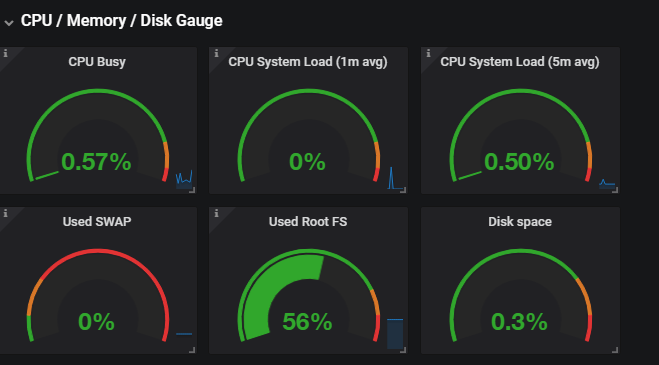
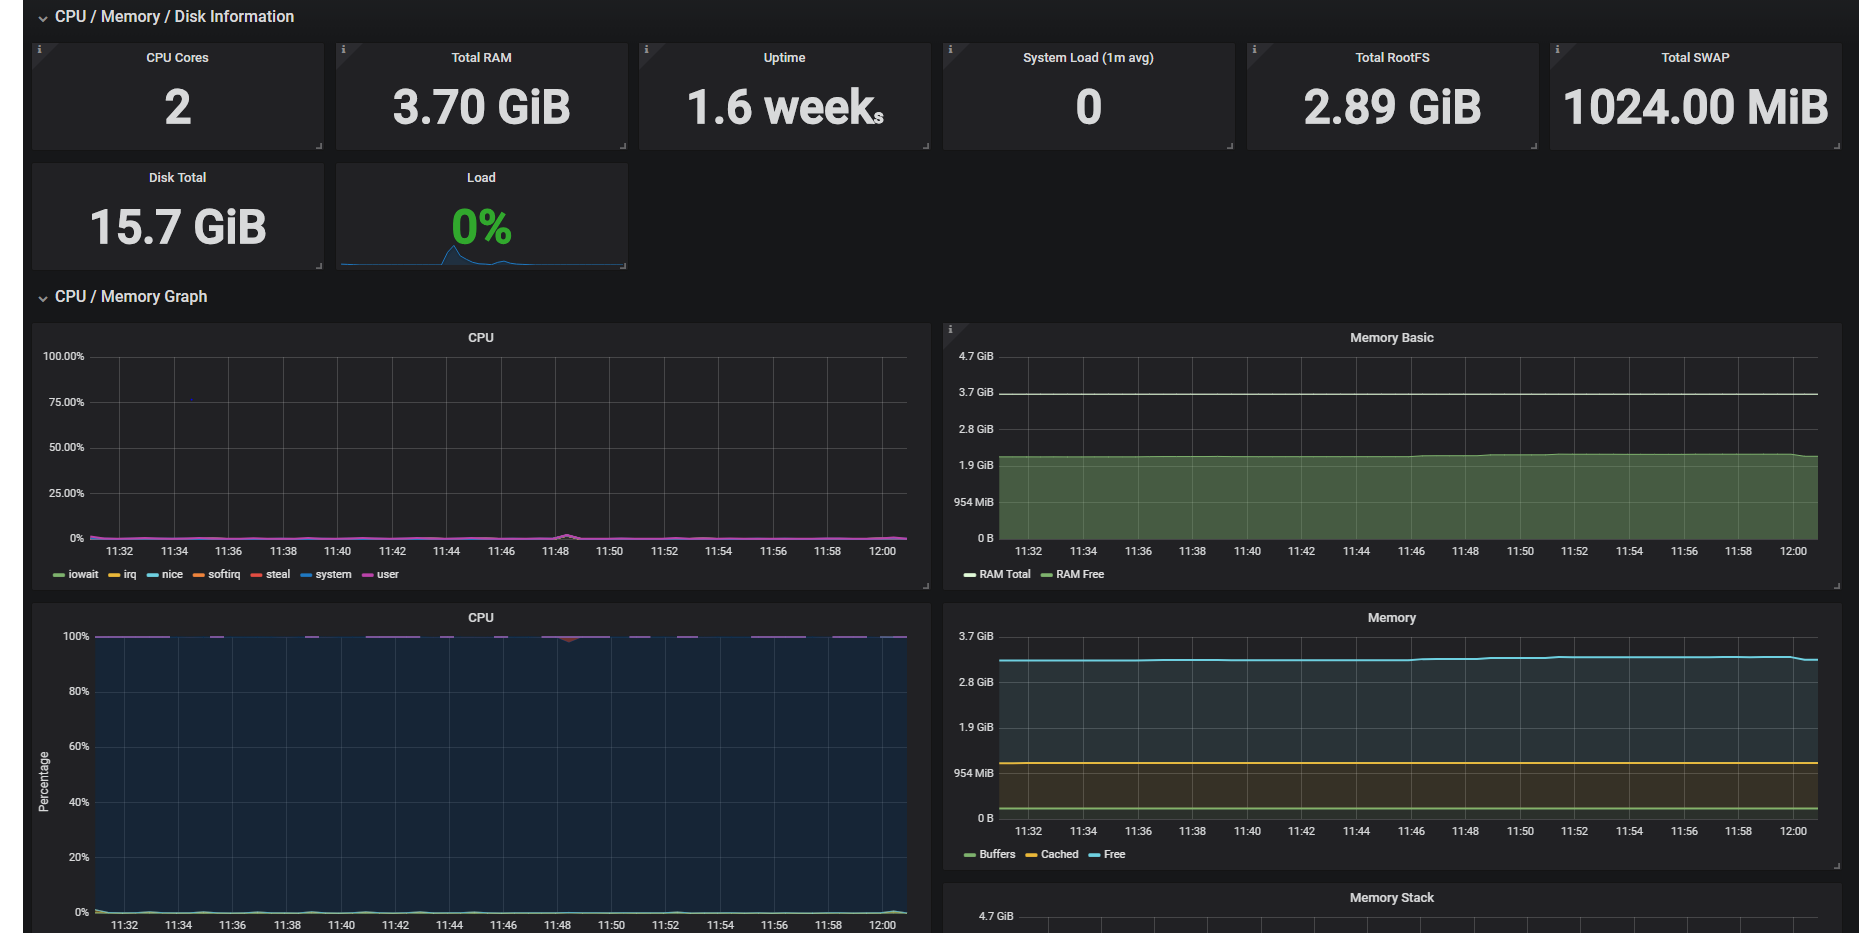
Metrics Shown (see screenshots)
- CPU
- Memory
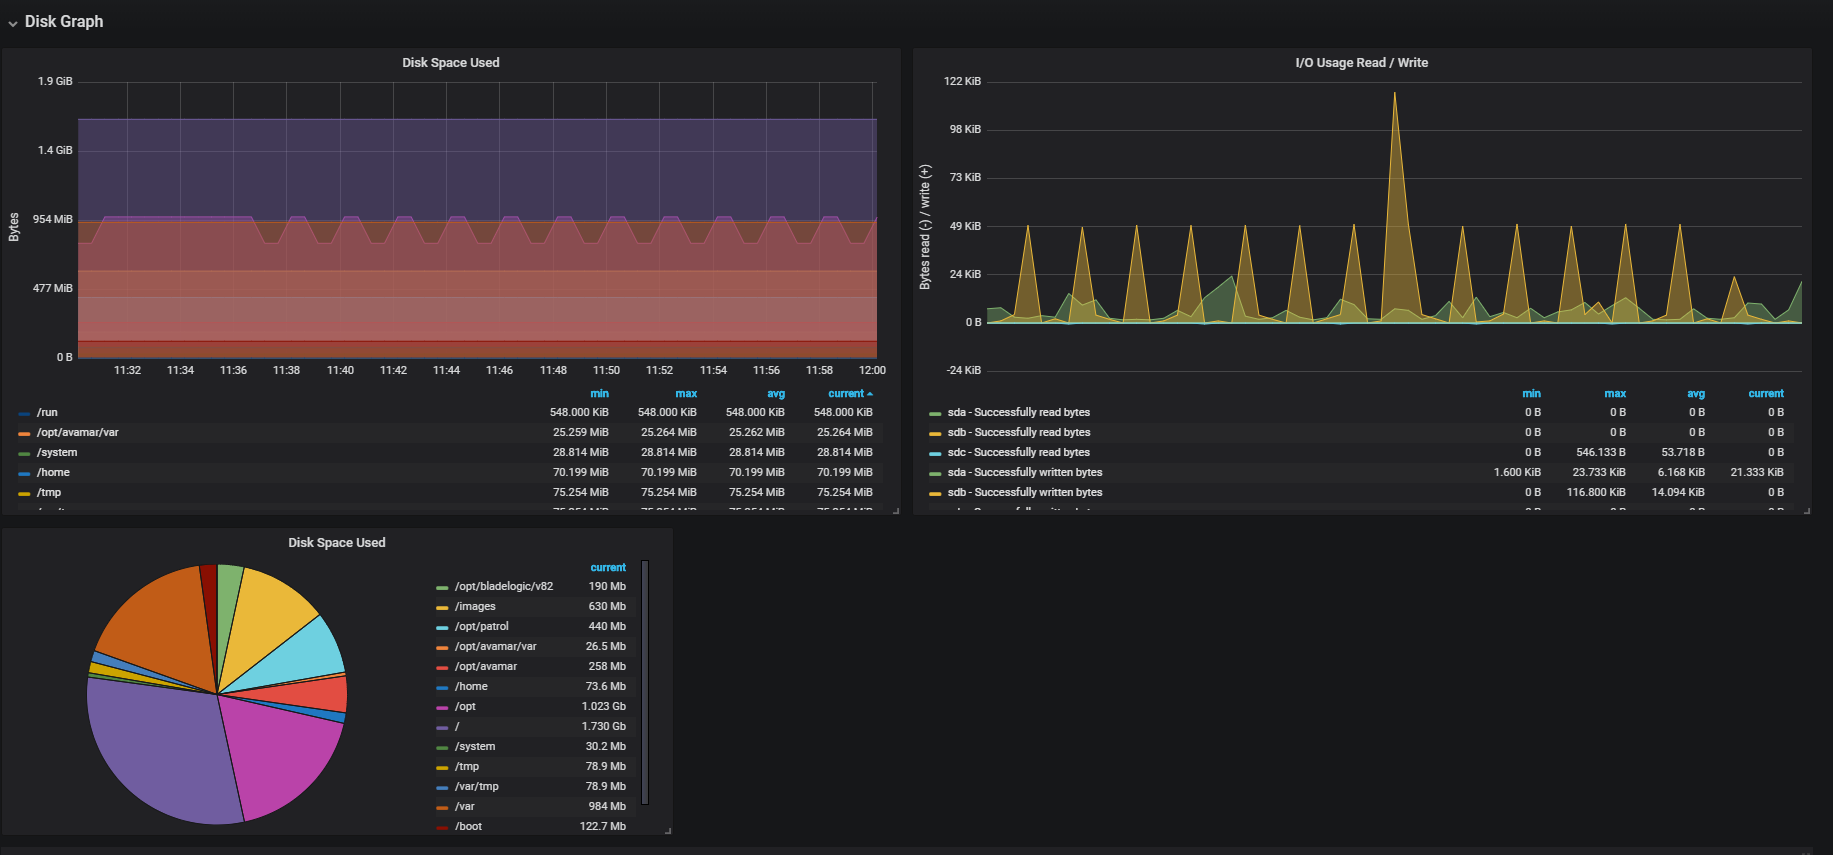
- Disk
- Network Overview
- Scraps Stats
Plugins Used
- Pie Chart v1.3.0 (optionnal)
Versions
- Prometheus: 2.2.1
- Node_exporter: 0.16.0-rc.3
- go version: go1.9.5
Collector Configuration Details
This Grafana Dashboard use by default Node Exporter metrics on Linux. Tested on RedHat 7.1
Available on Github
Make this dashboard better with your feedback and ideas with openning a issue on GitHub : https://github.com/enzobes/Grafana-Dashboard
Data source config
Collector type:
Collector plugins:
Collector config:
Revisions
Upload an updated version of an exported dashboard.json file from Grafana
| Revision | Description | Created | |
|---|---|---|---|
| Download |
Linux Server
Monitor Linux with Grafana. Easily monitor your Linux deployment with Grafana Cloud's out-of-the-box monitoring solution.
Learn more