Telegraf metrics
InfluxDB dashboards for telegraf metrics

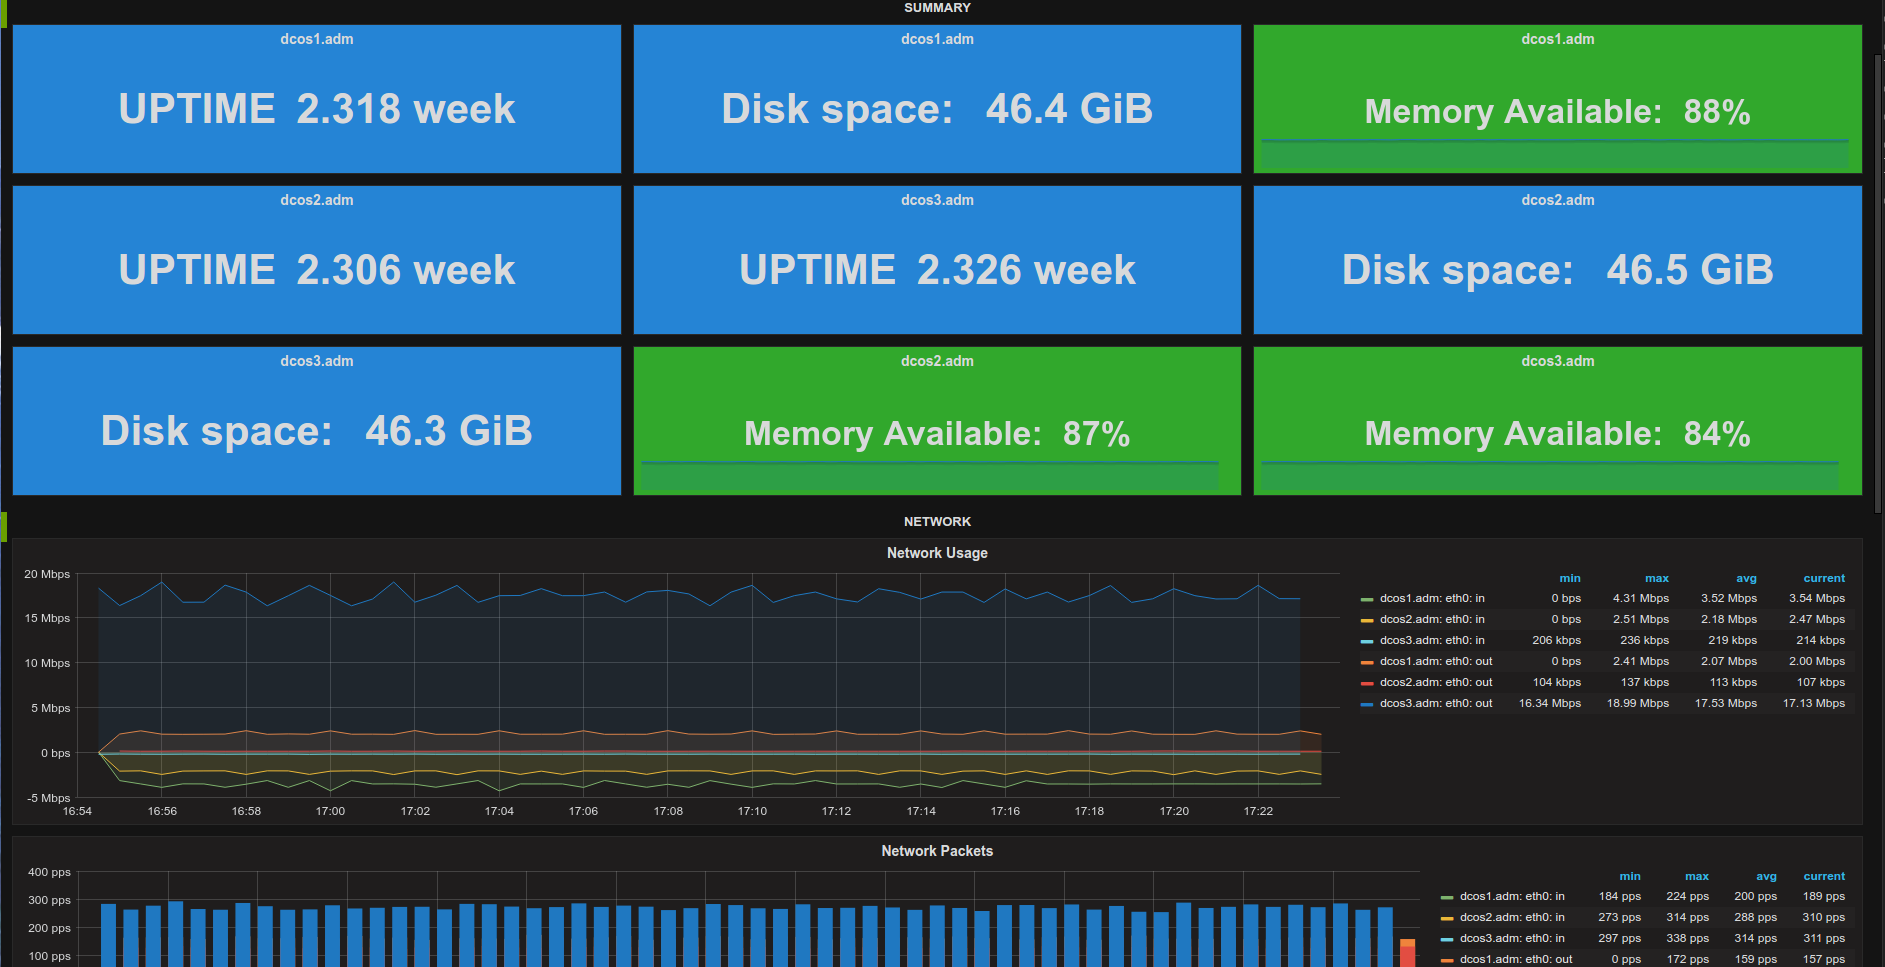
Dashboard for Telegraf plugins and system/network metrics.
Plugins:
- Apache
- ElasticSearch
- Memcached
- MongoDB
- Nginx
- OpCache
- PHP FPM
- RabbitMQ
- Redis
- Passenger
- MySQL
- Varnish 3/4
- Mcrouter
- Docker
- Nsq
Data source config
Collector type:
Collector plugins:
Collector config:
Revisions
Upload an updated version of an exported dashboard.json file from Grafana
| Revision | Description | Created | |
|---|---|---|---|
| Download |