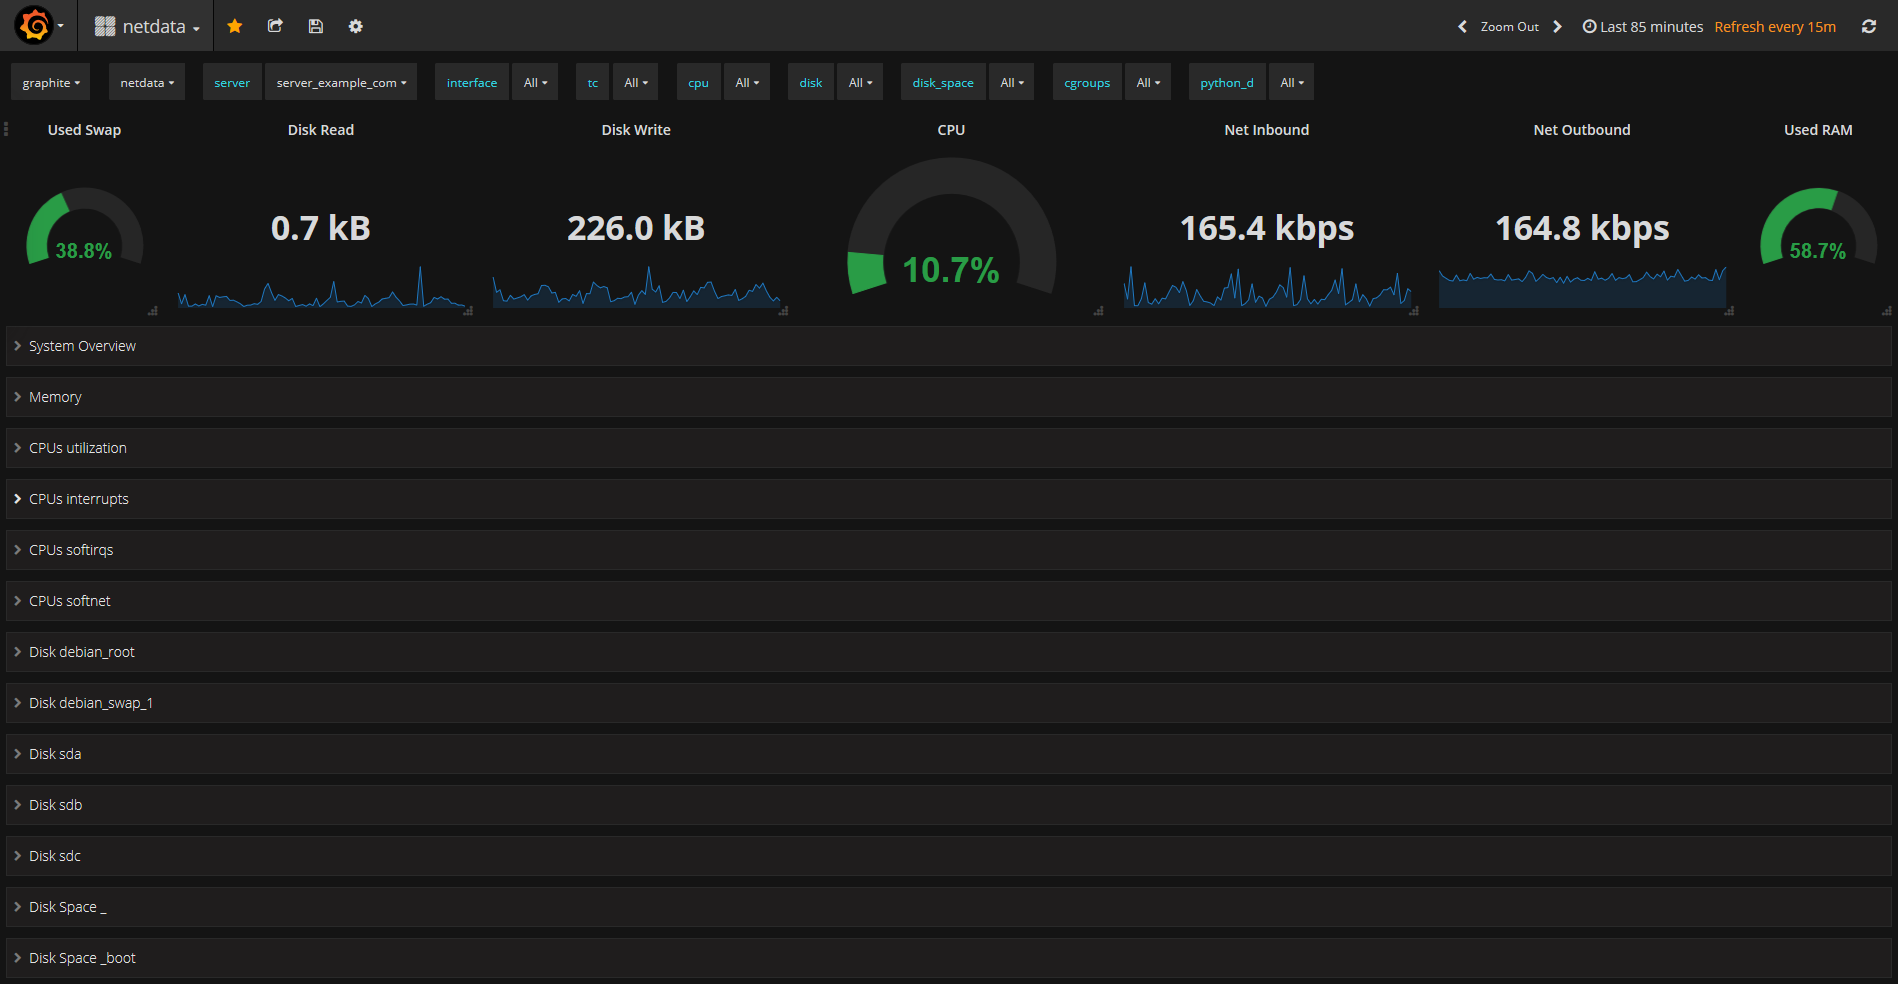
netdata Graphite
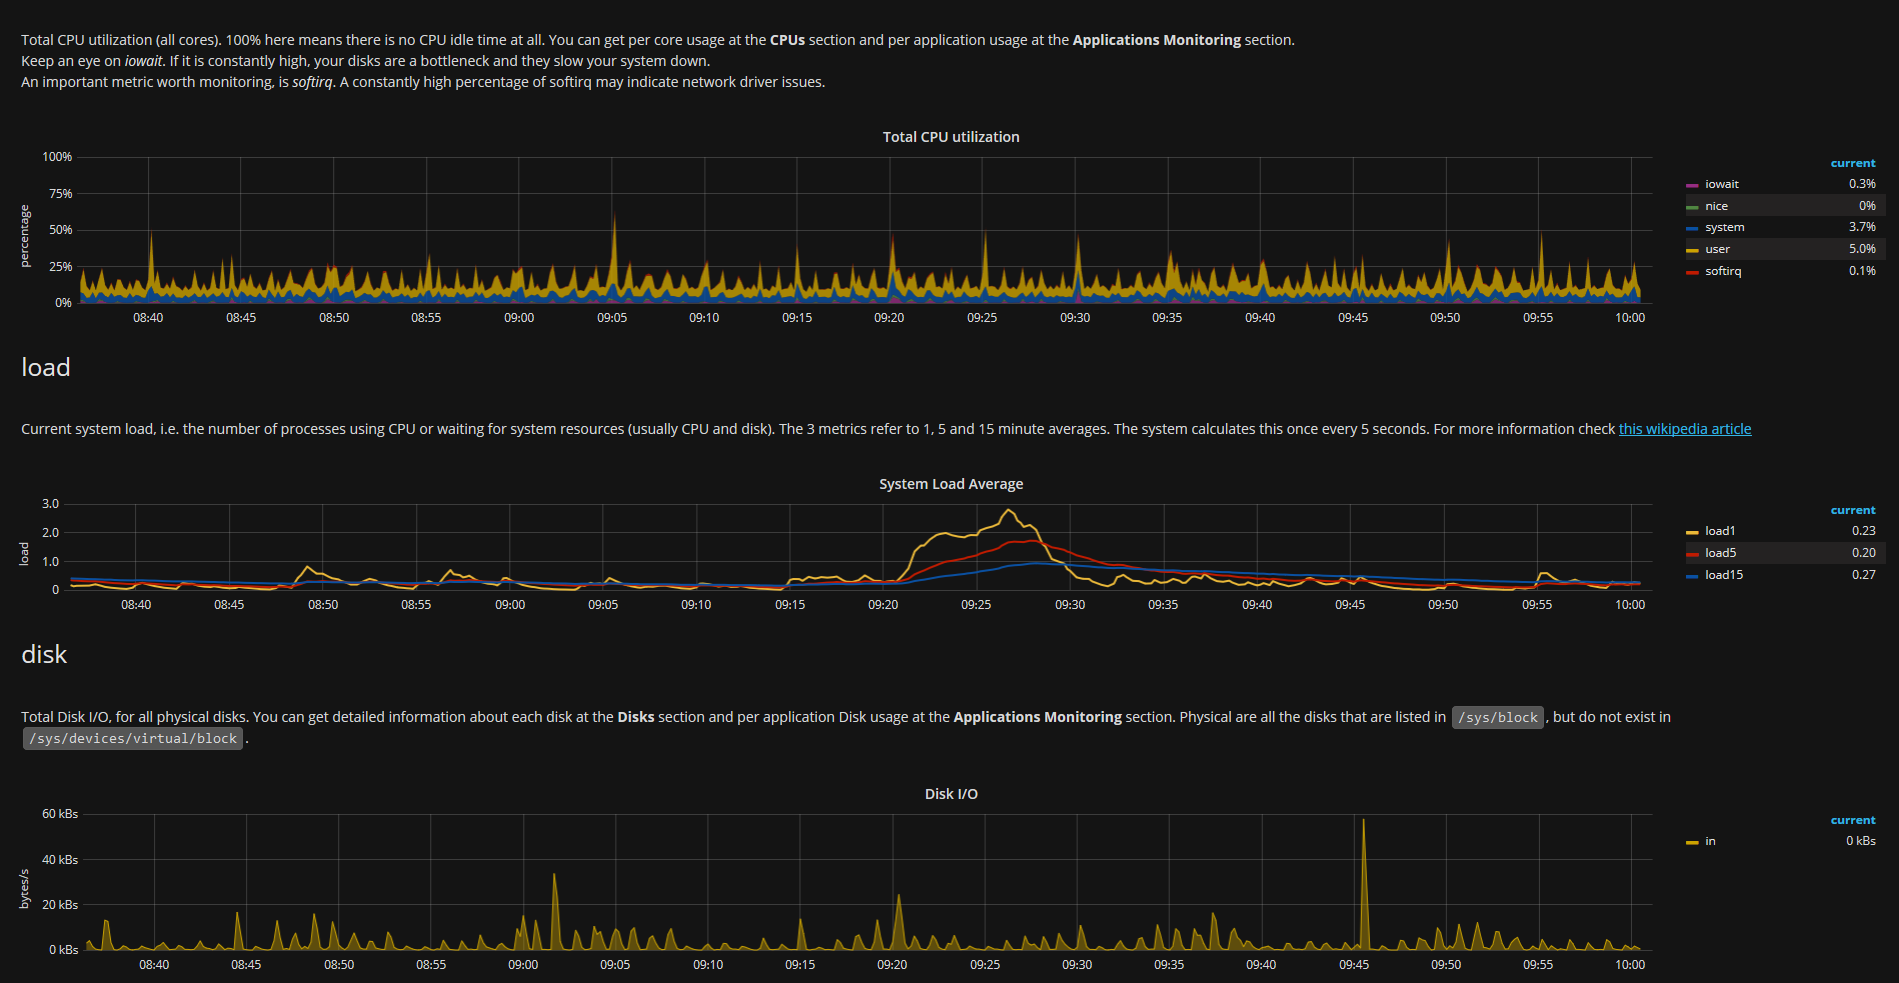
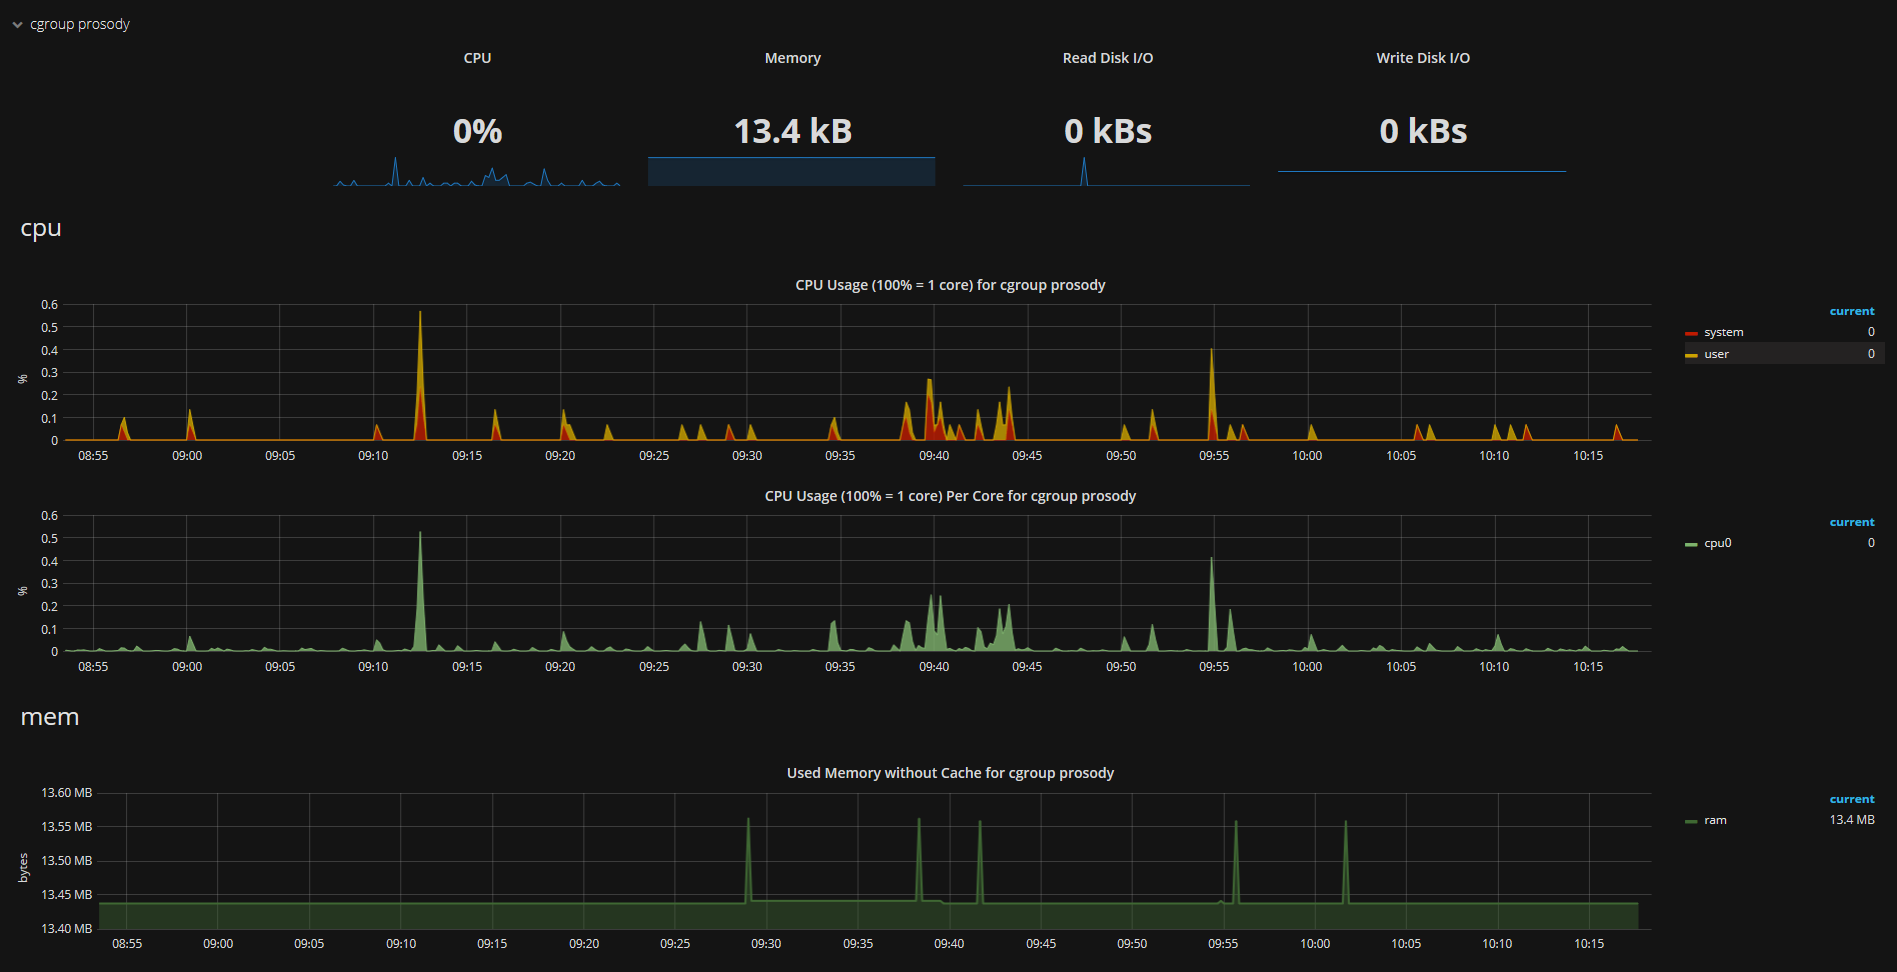
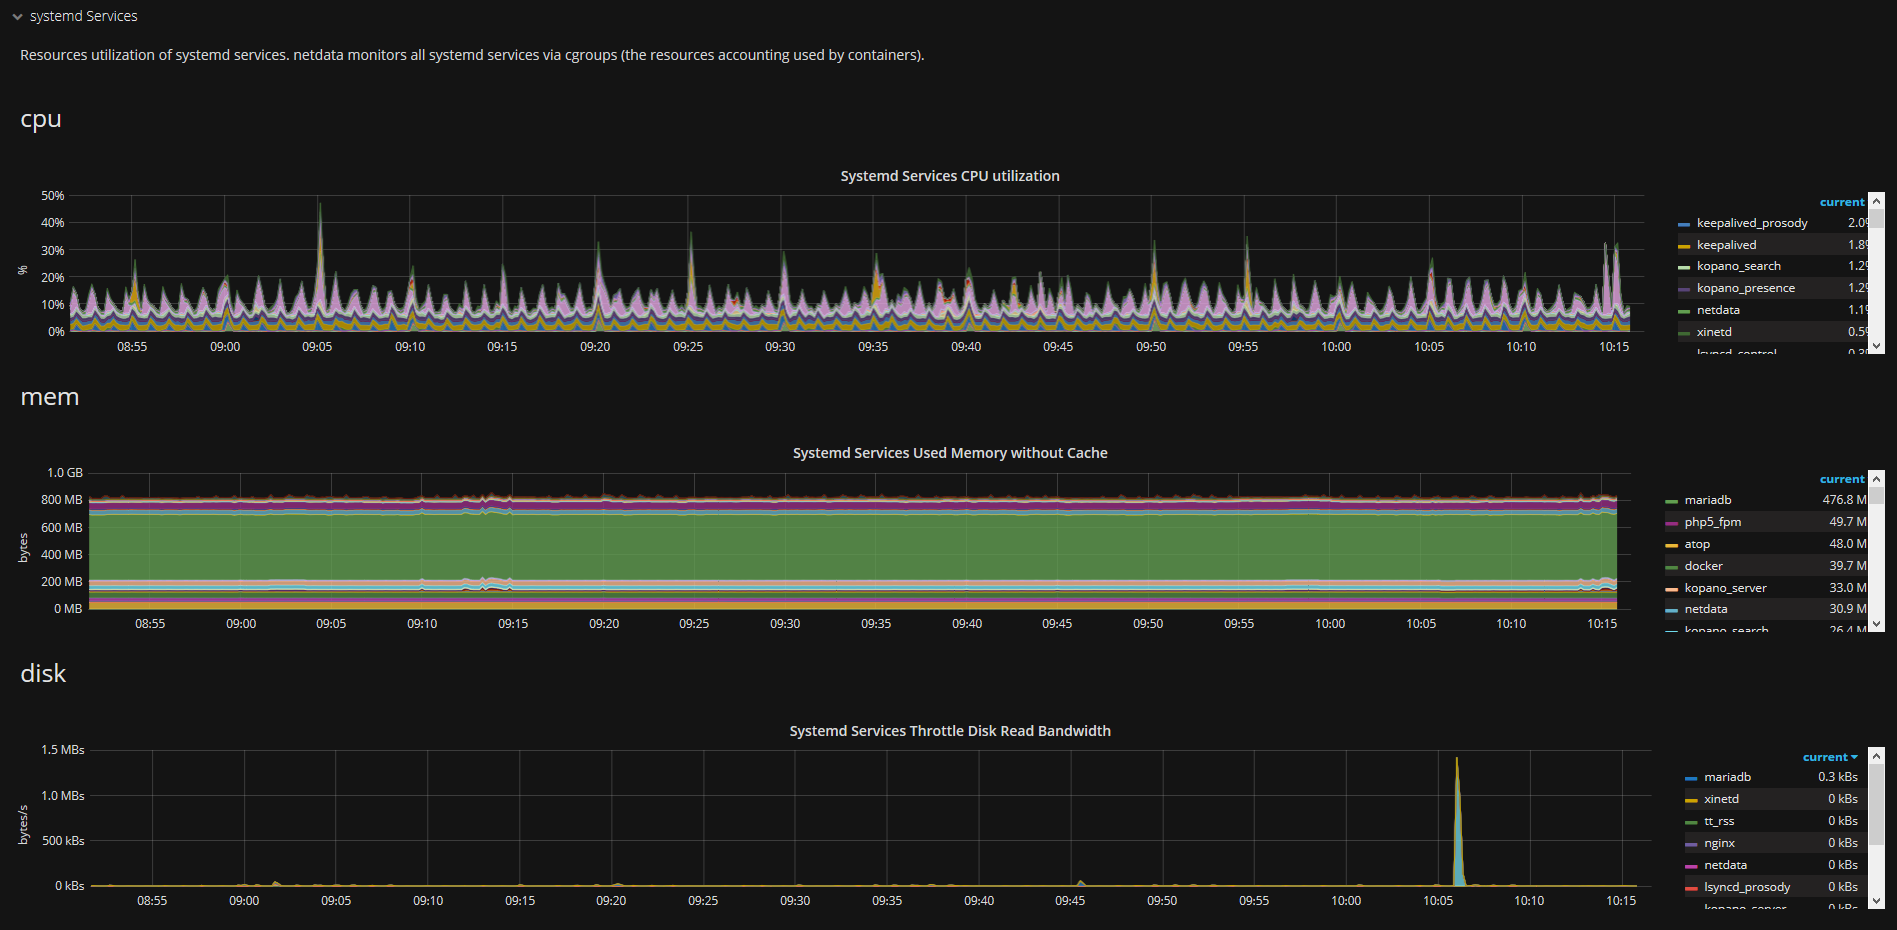
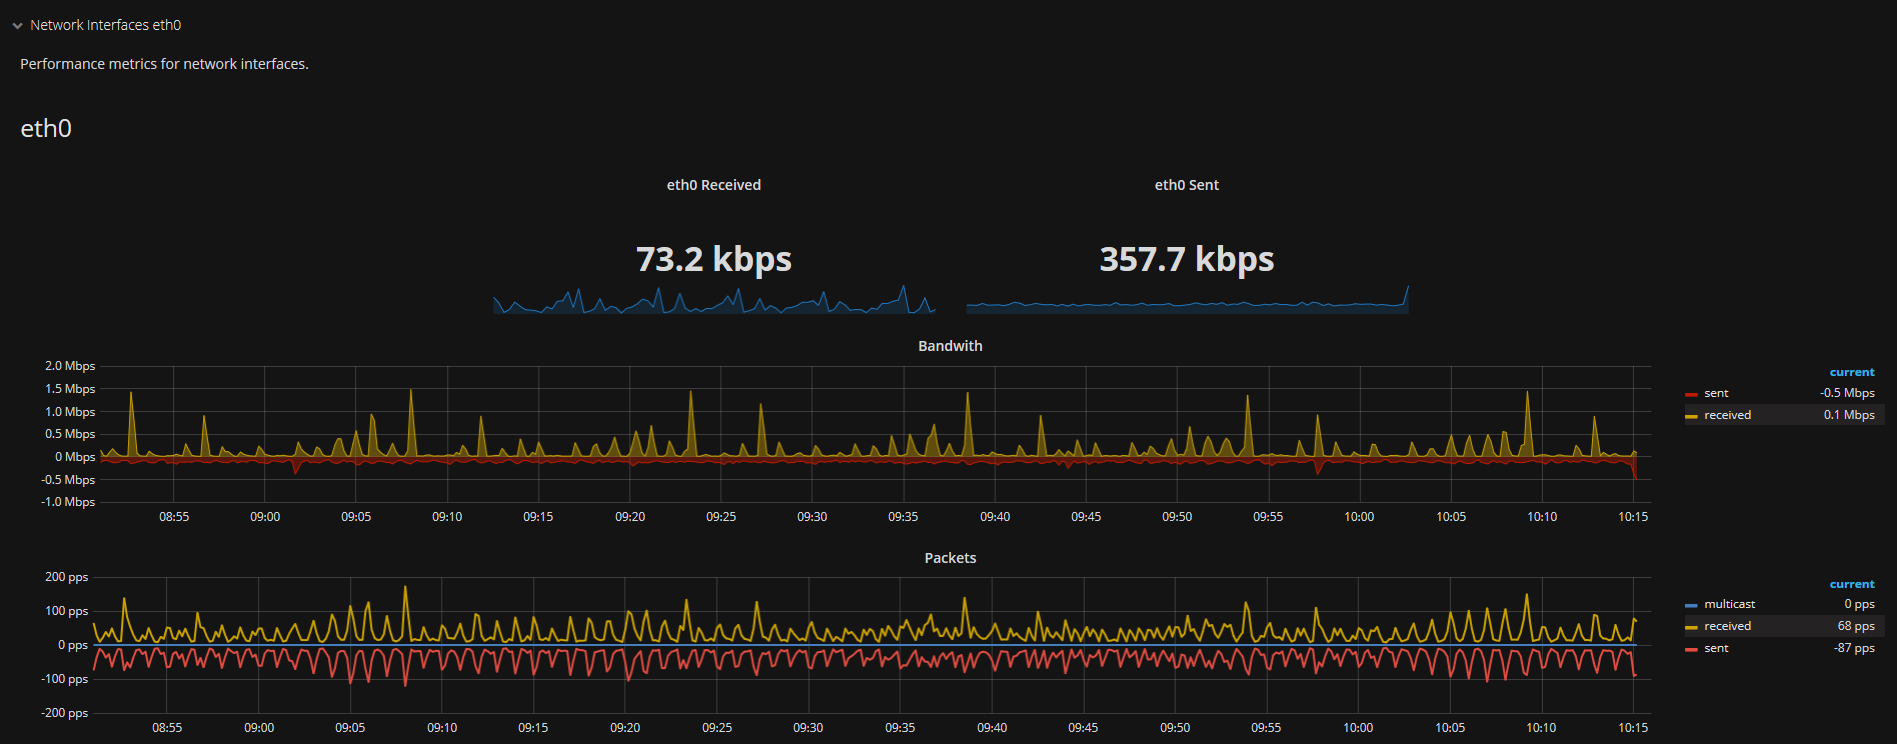
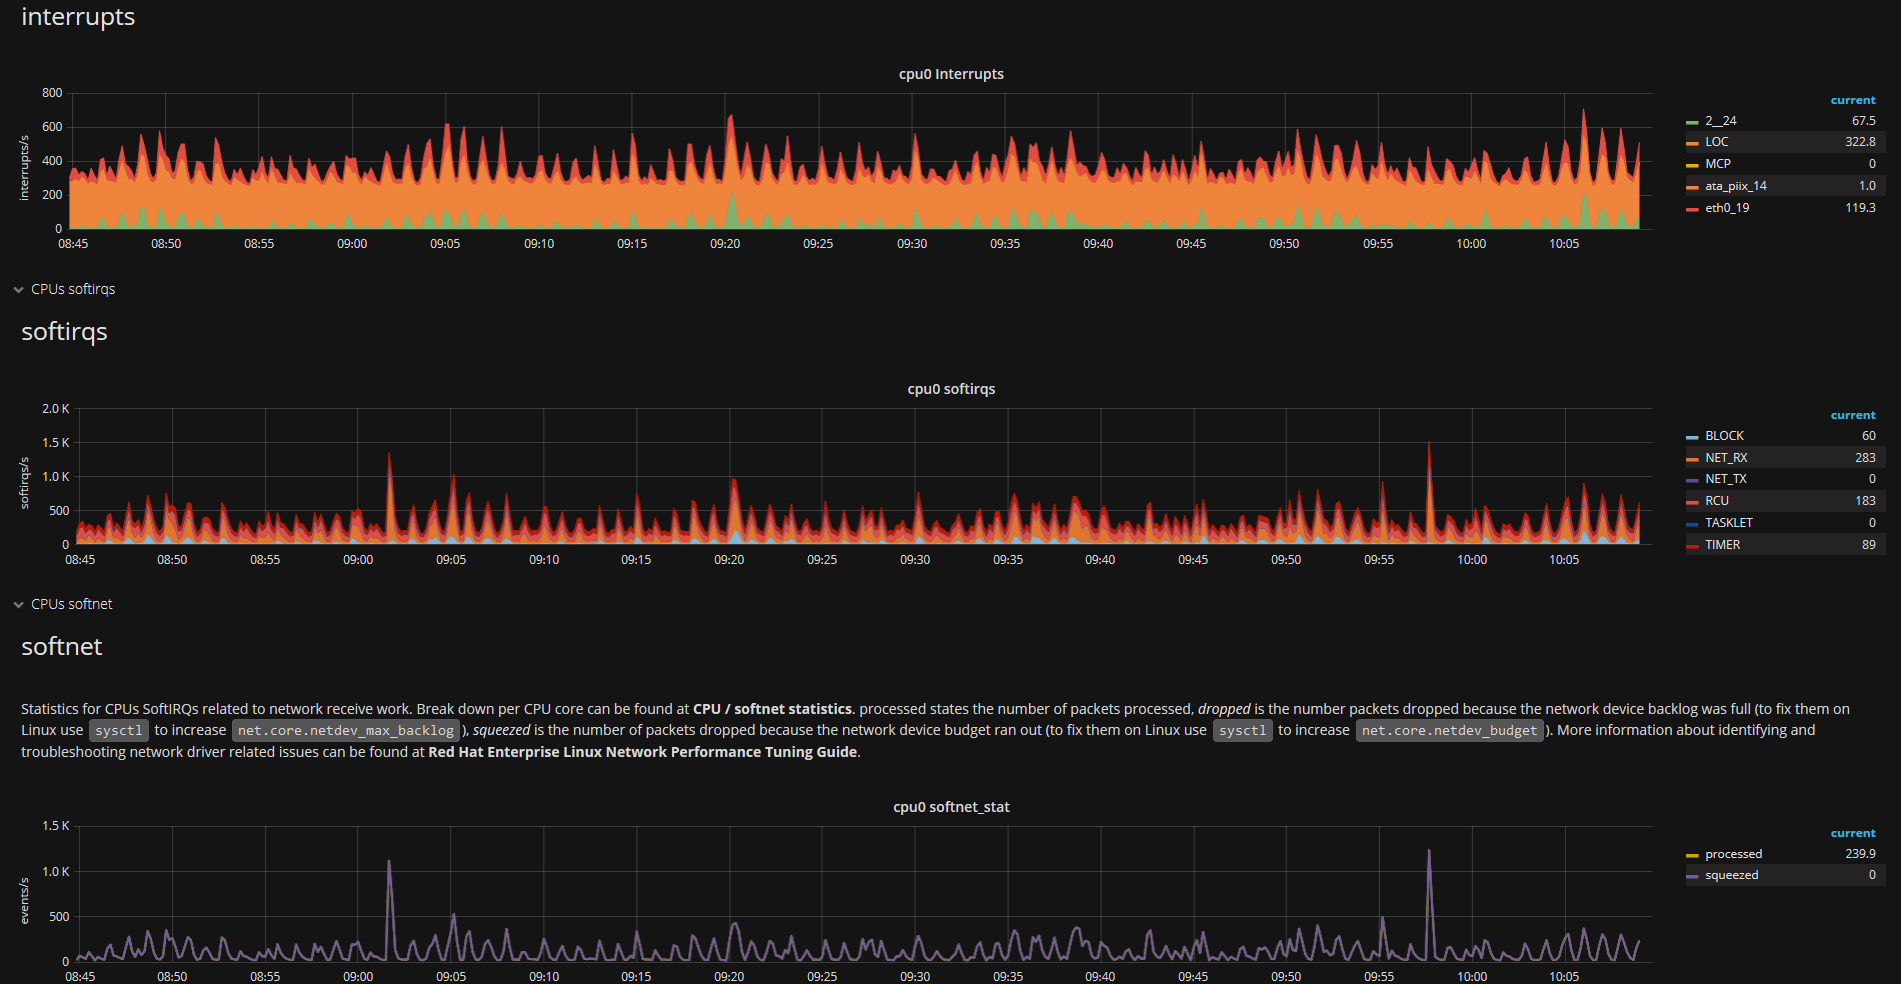
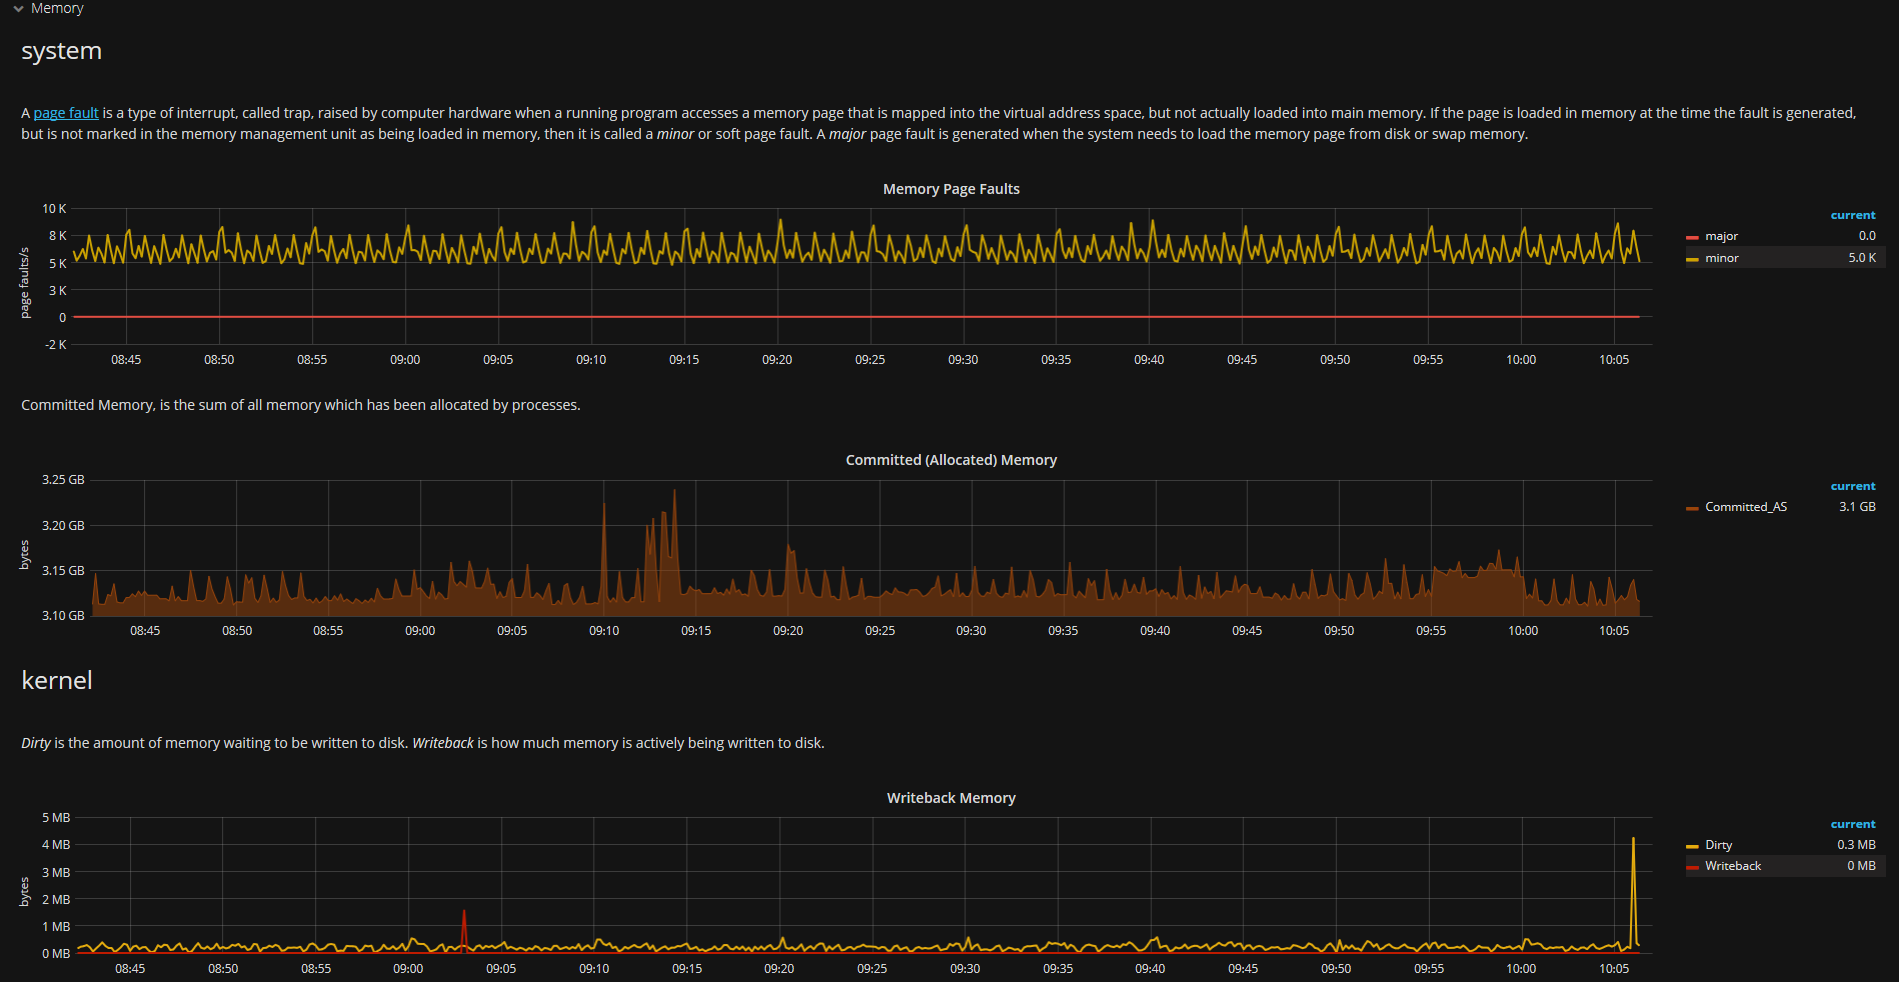
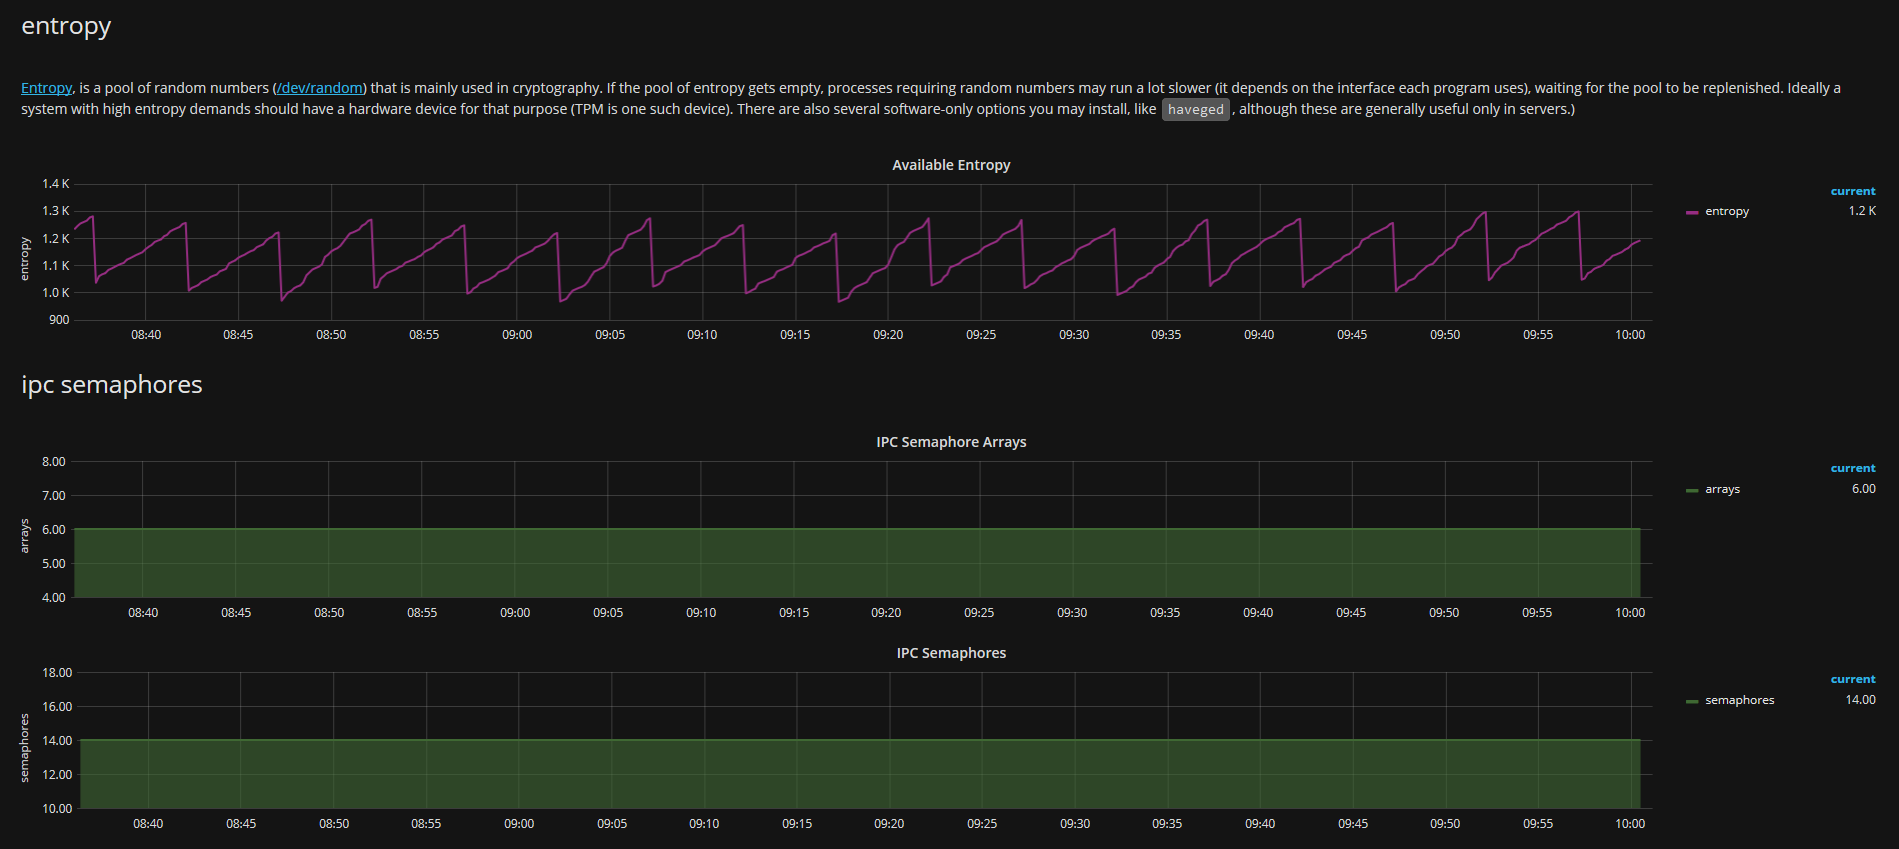
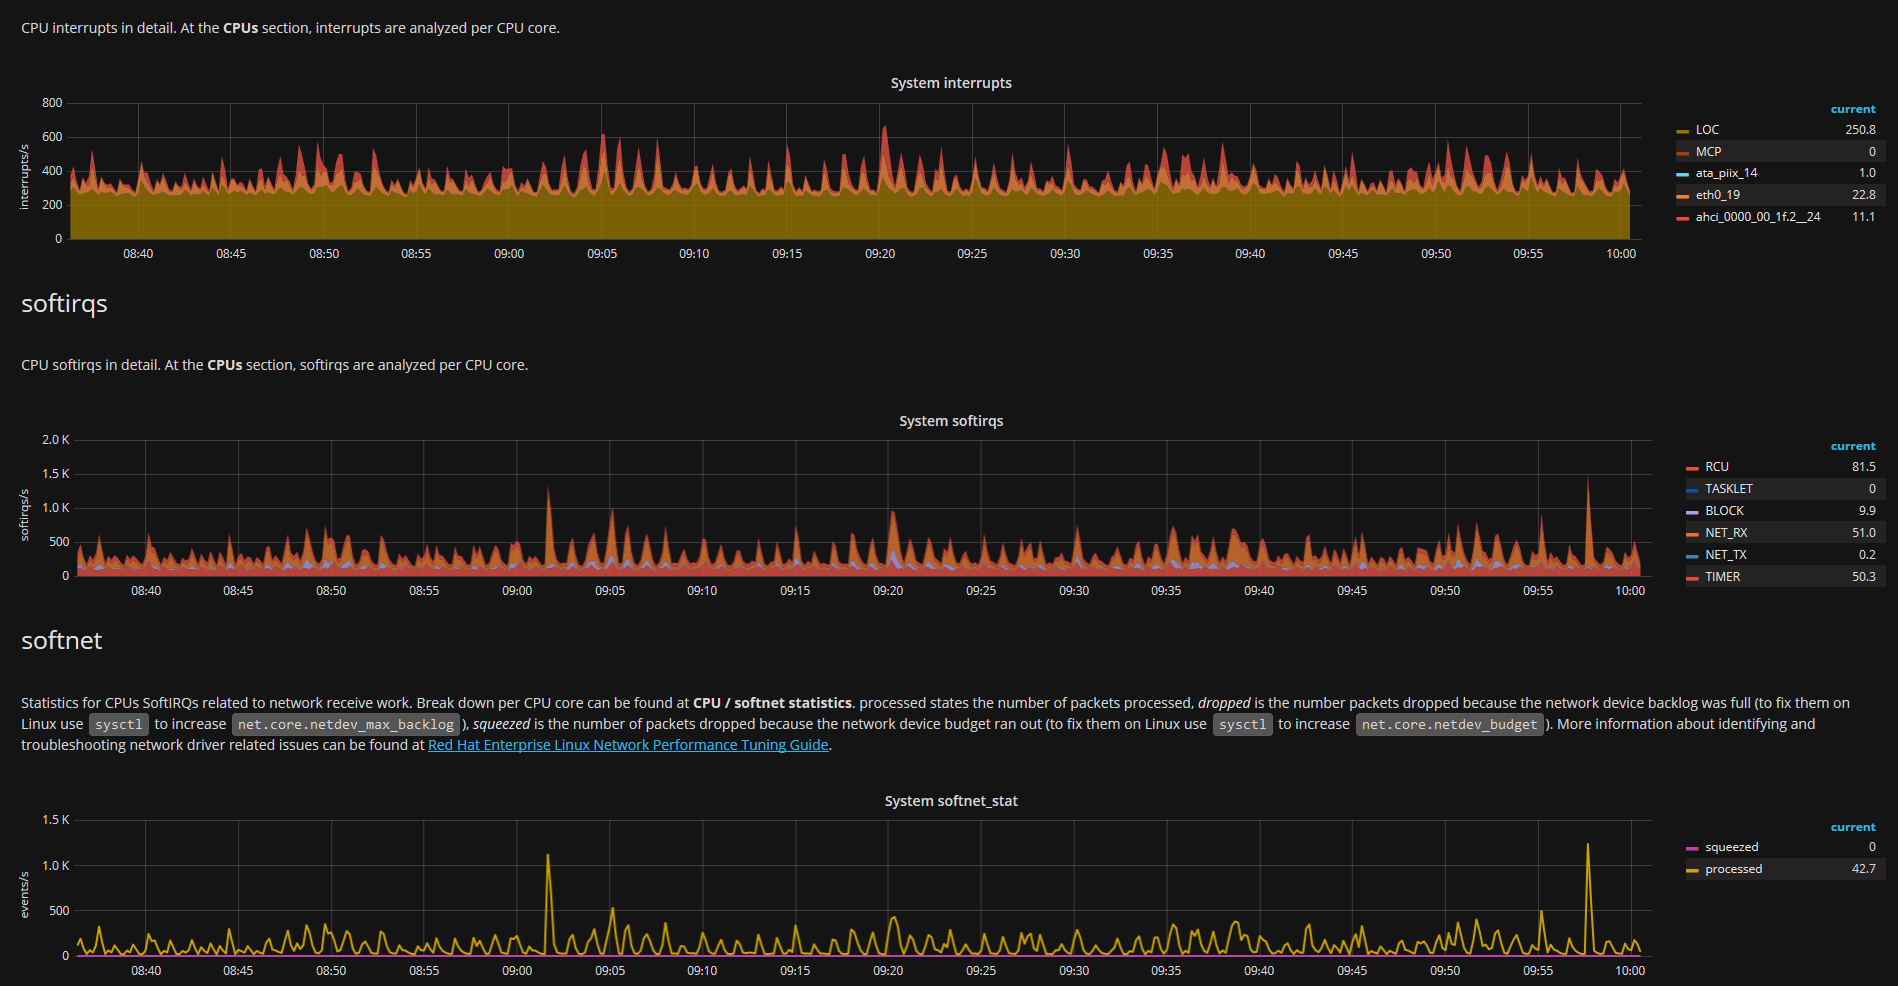
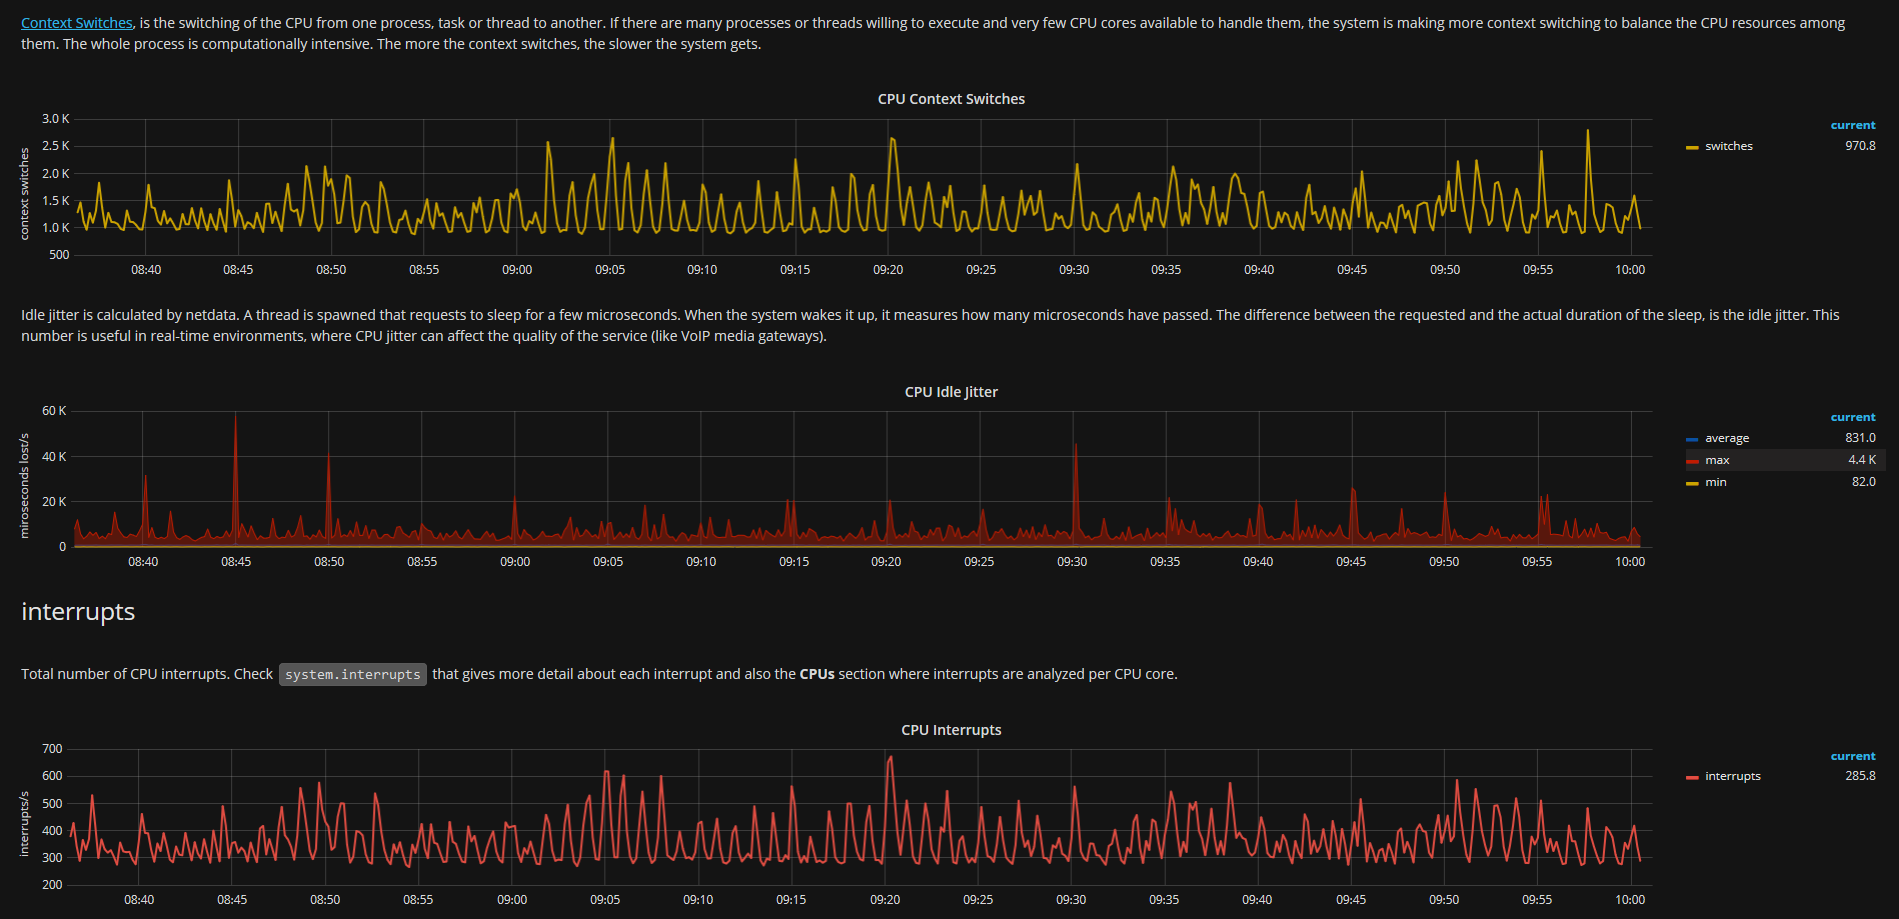
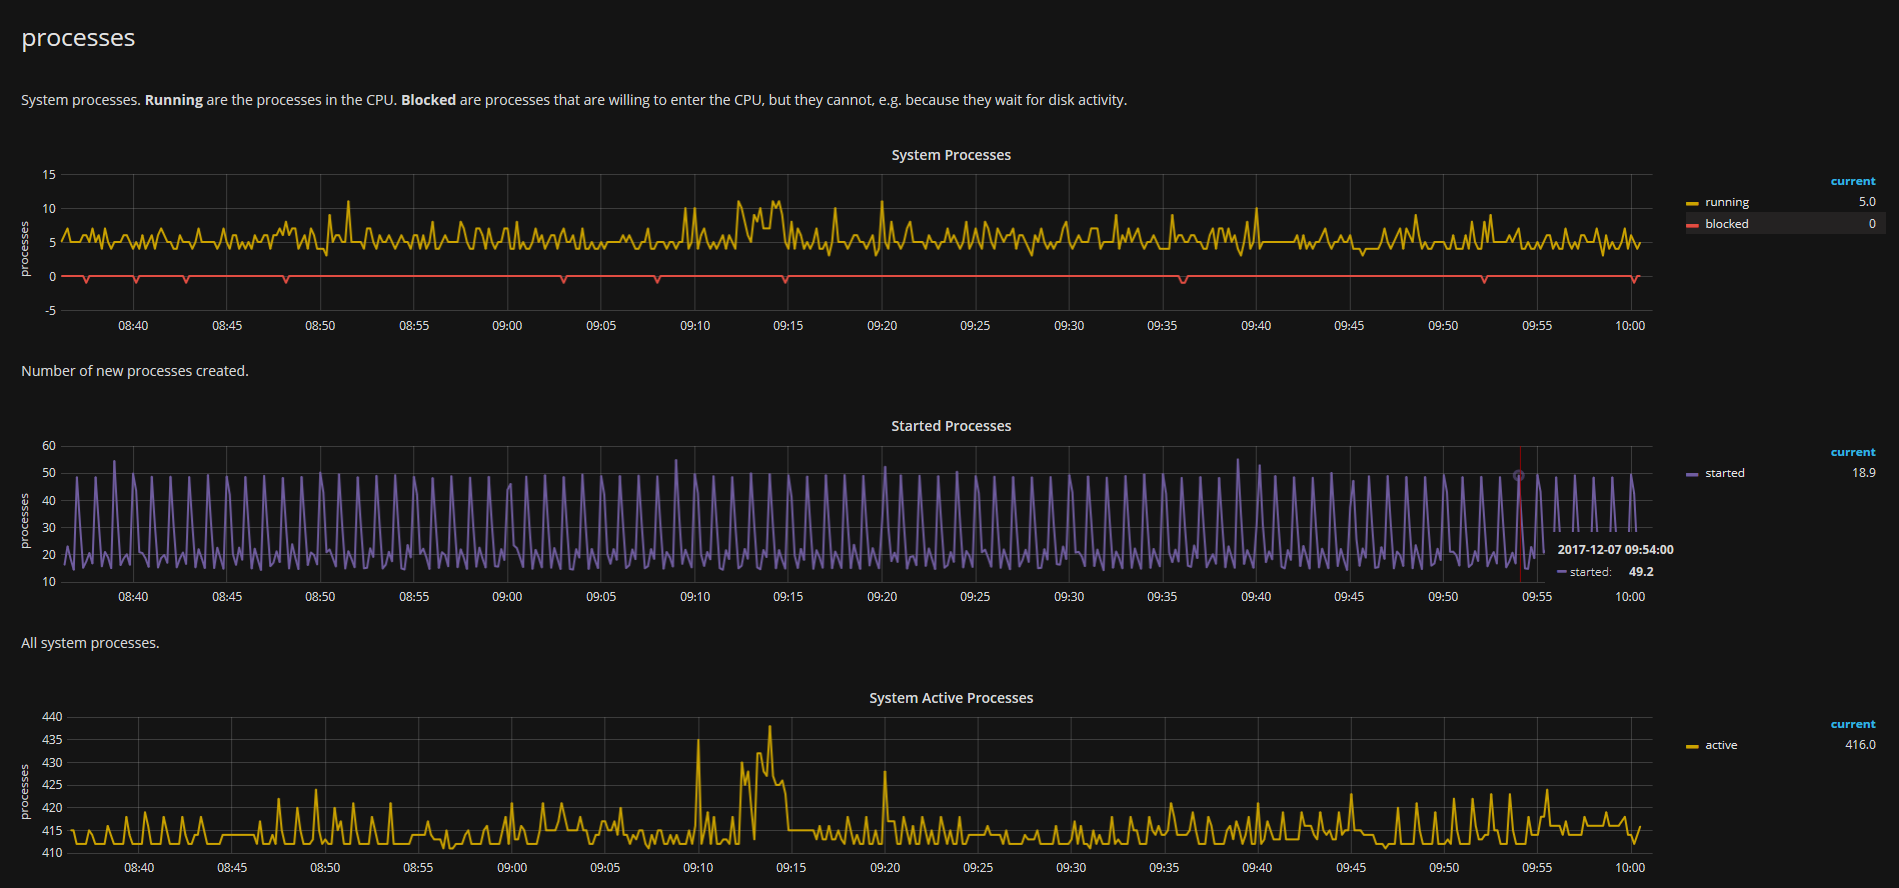
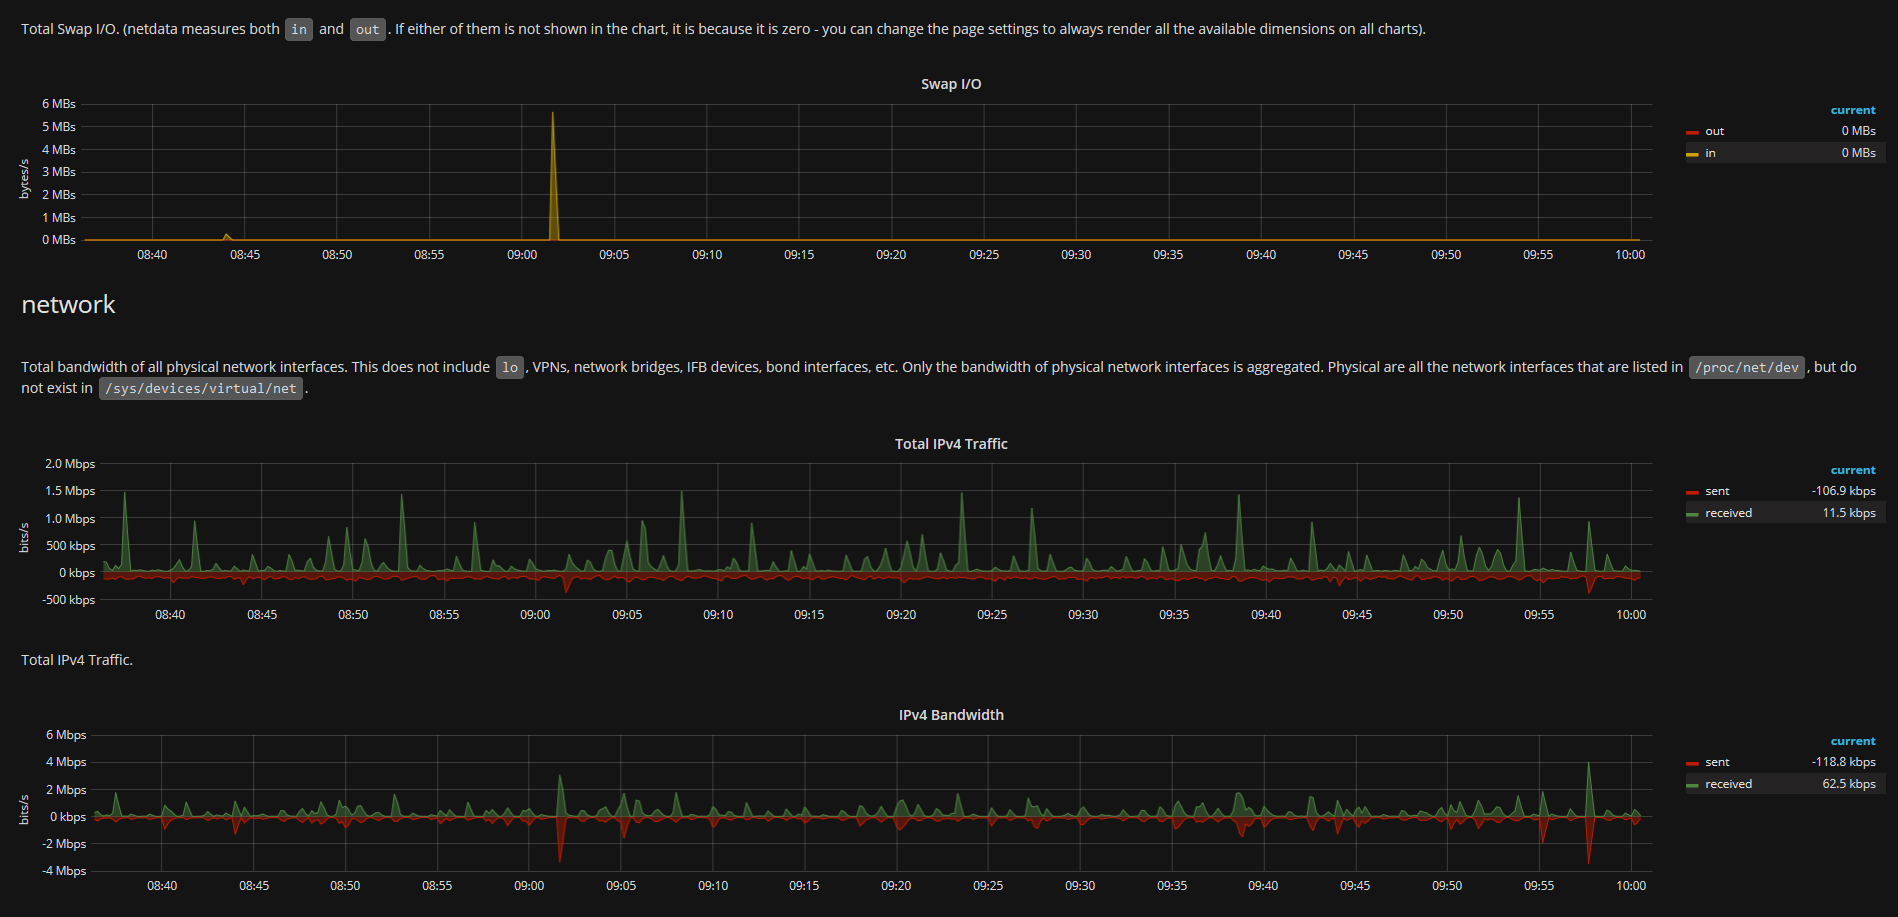
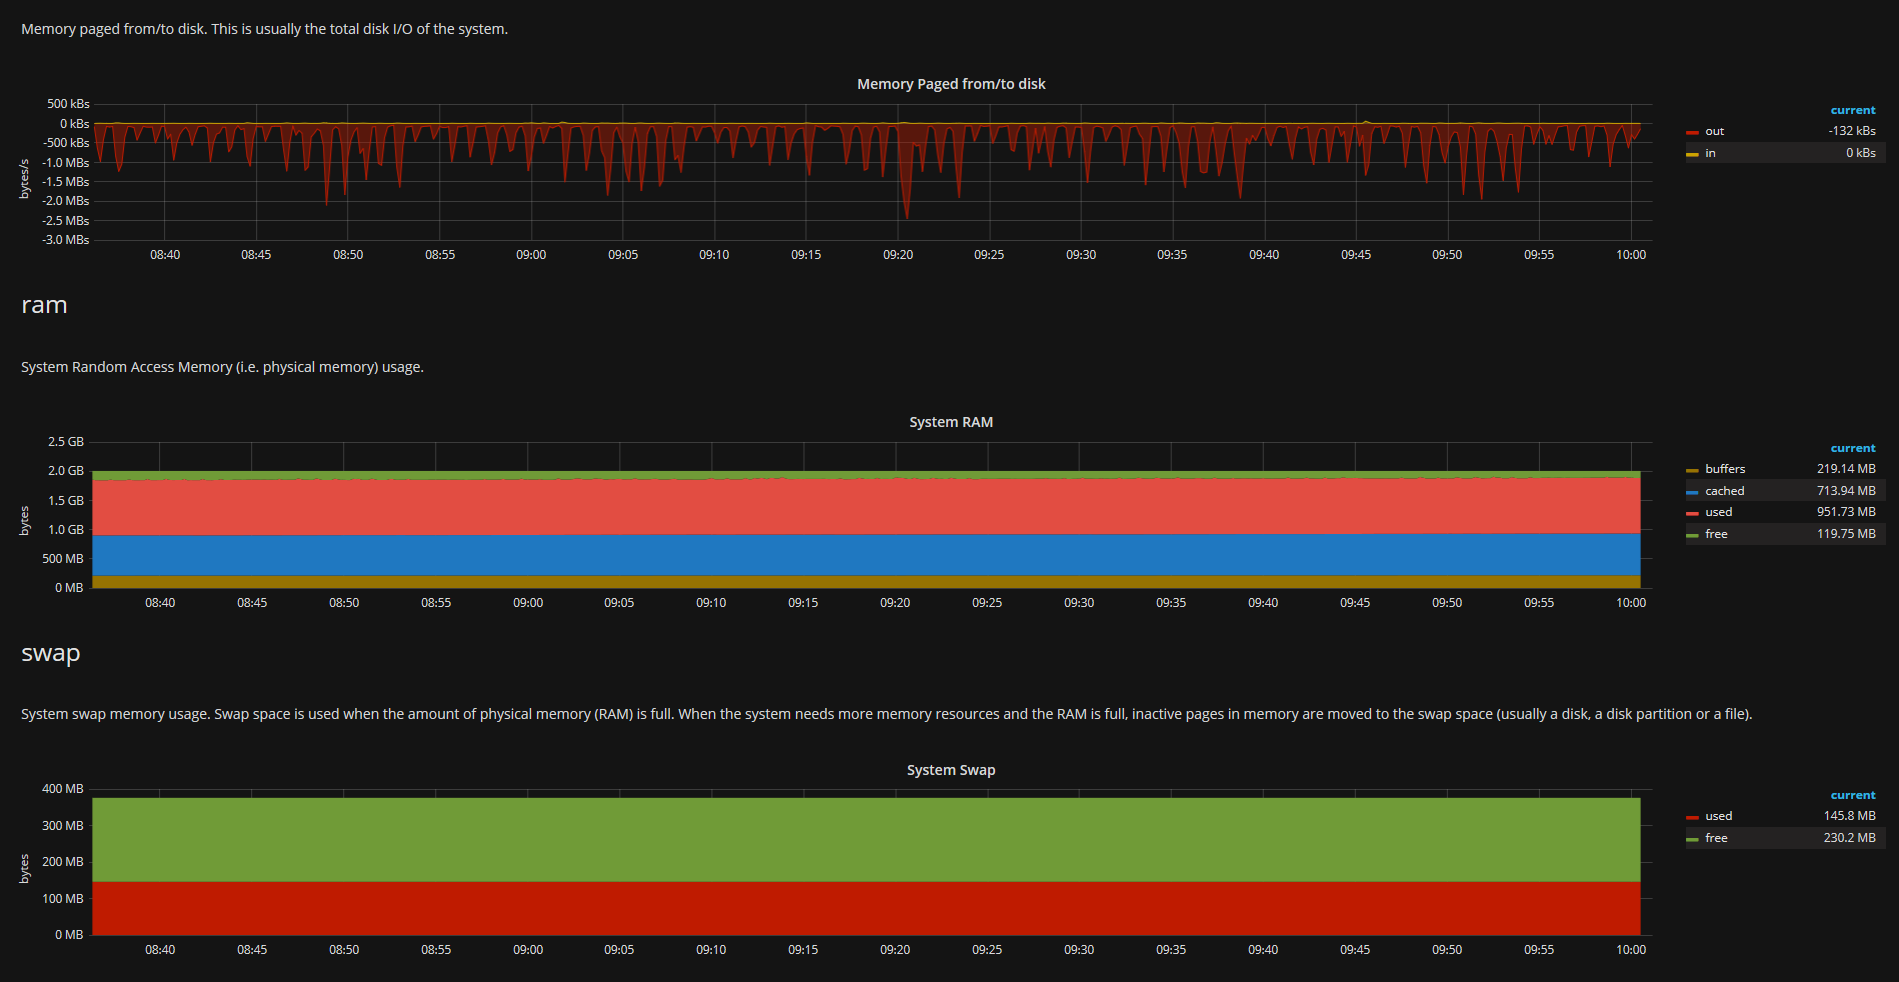
Massive collection of netdata graphs via Graphite.
netdata Graphite Dashboard
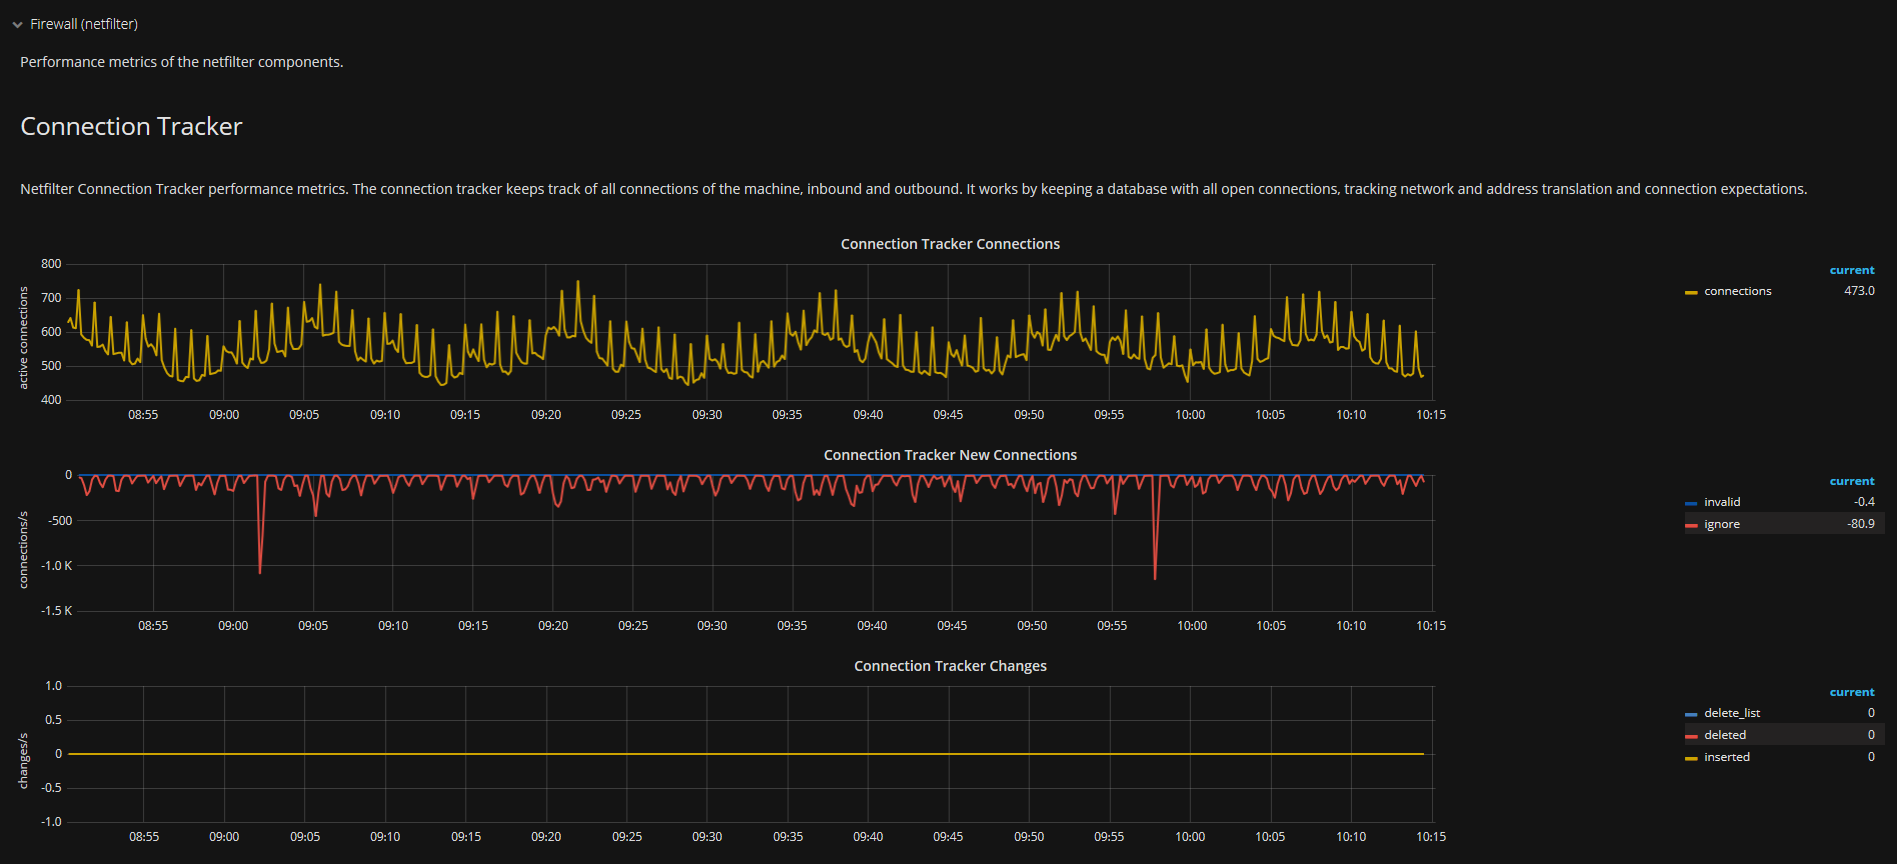
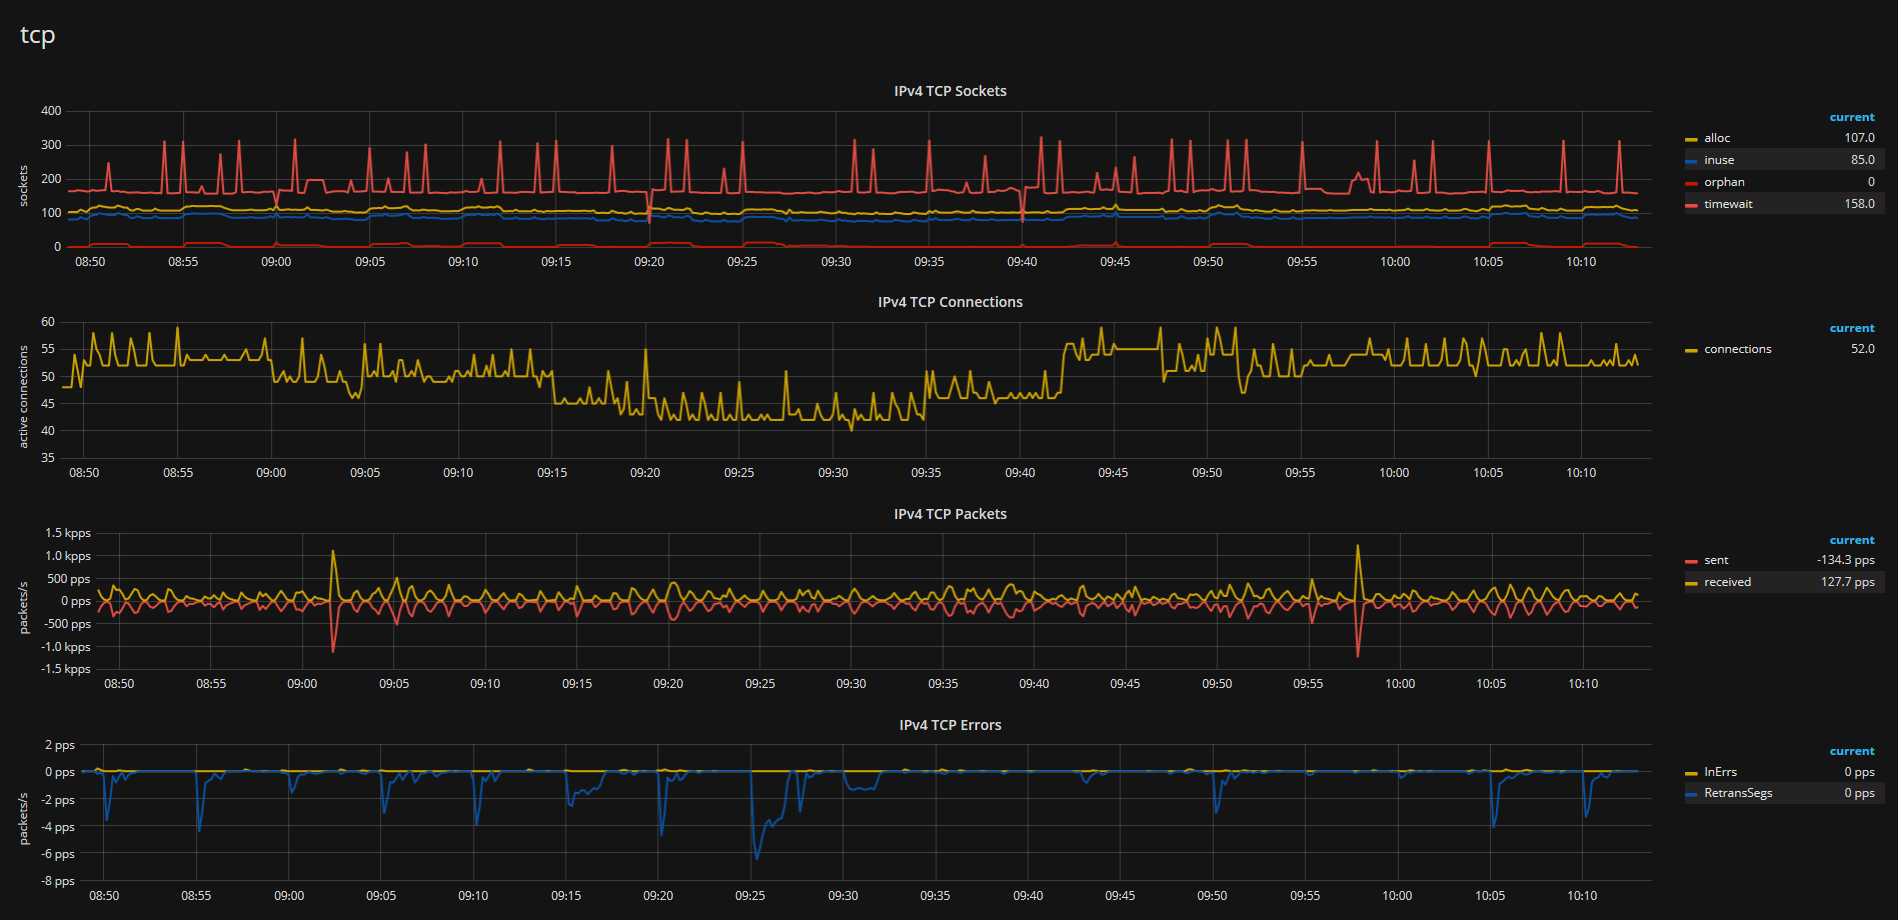
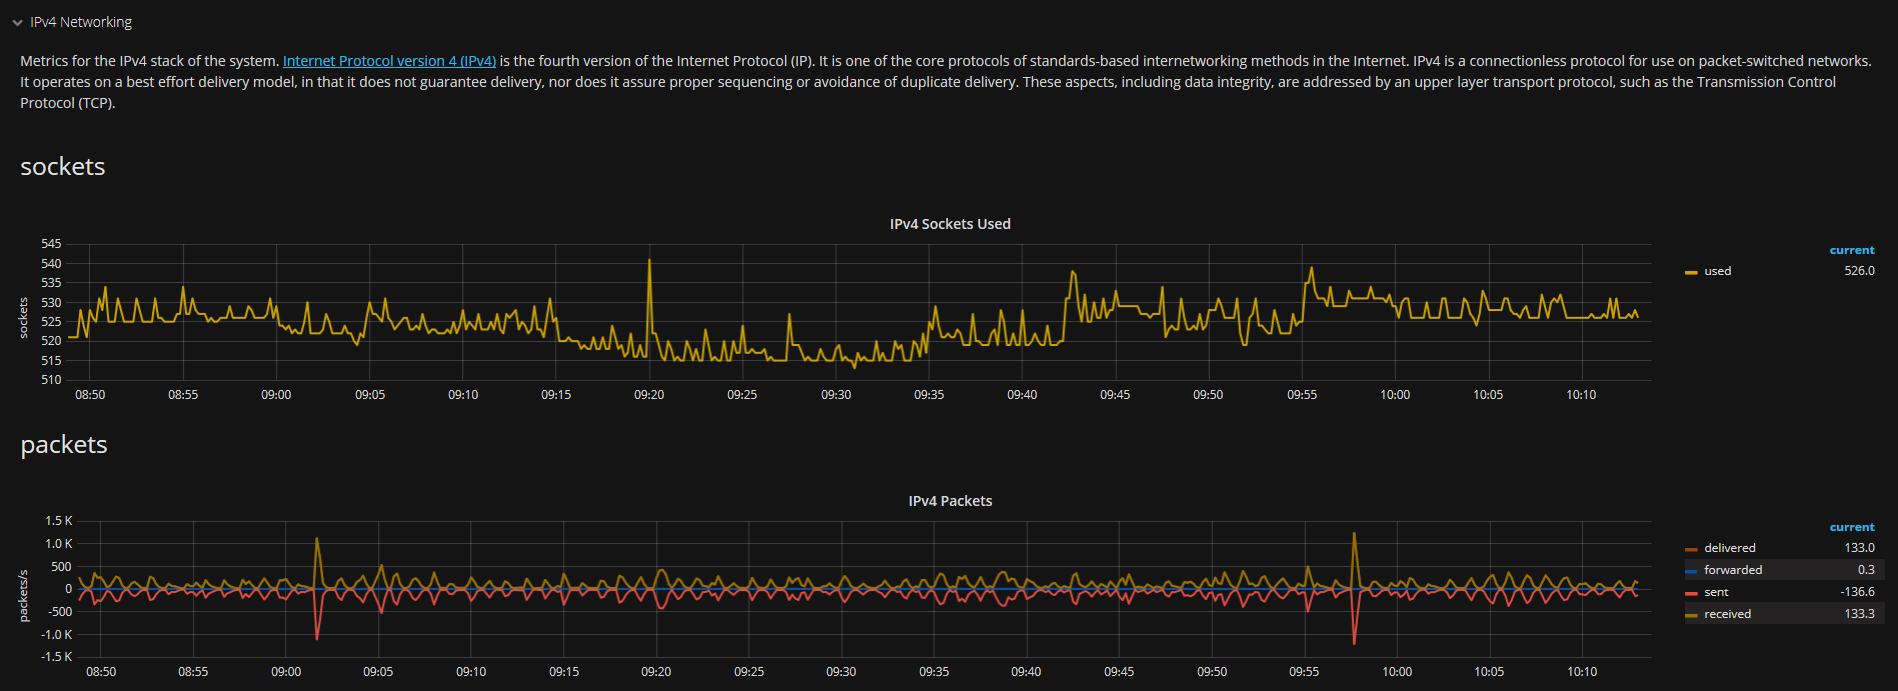
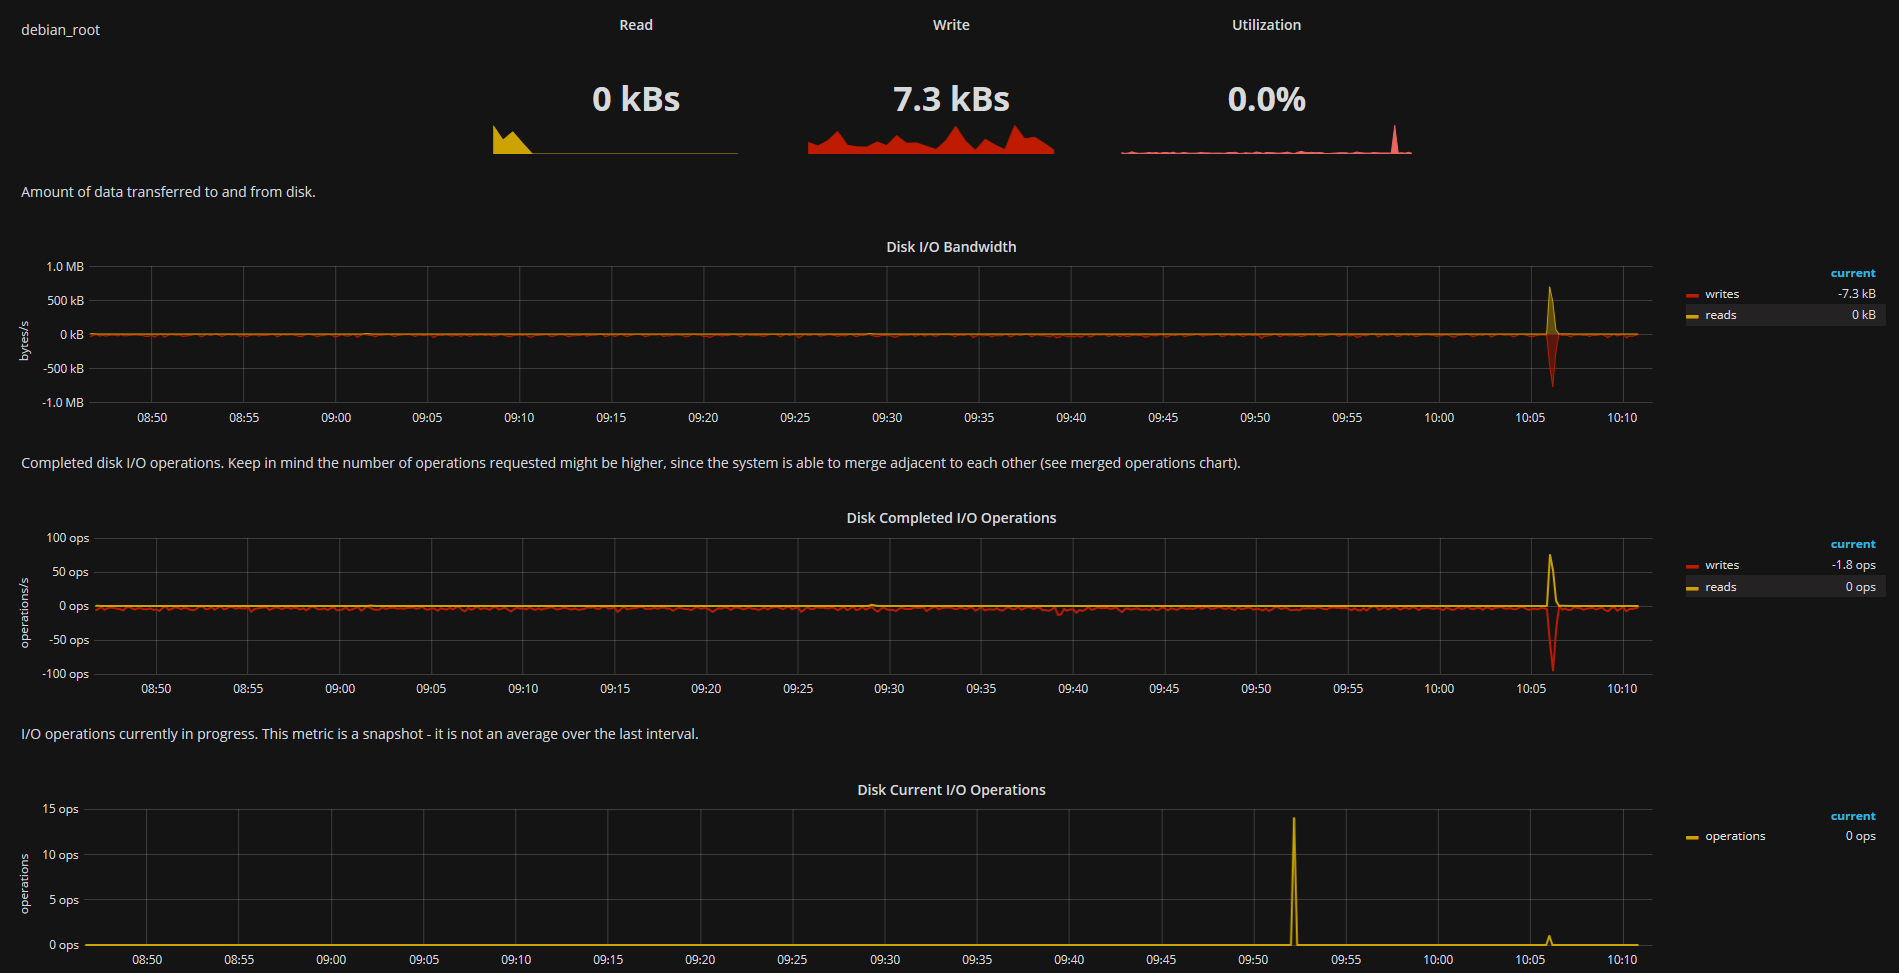
Metrics provided by netdata, written into Graphite and displayed via Grafana!
Compatibility
- netdata v1.8.0
- It should display the most panels for a default installation of linux.
- It's tested on Debian Stretch x64, OSMC (on Raspberry PI2) & armbian (on OrangePi+2E).
- This dashboard uses templating heavily but as a limitation of grafana it is not possible to hide panels with no data.
- Special handling of data provided by the use of docker at the collected hosts.
Metric Field description
datasource= your graphite datasource for this dashboard.rootdir= also known as prefix, used to summarize metrics of a collector.server= Server Name without.. Please see Rewrites Section.
Additional Metrics
You can see them at the top of the dashboard.
interface= Network interfacestc= Quality of Servicecpu= CPUsdisk= Disk IOPsdisk_space= Disk Spacecgroupplugin= Output of cgroup pluginpythonplugin= Output of python plugin
Dependencies
- netdata (https://my-netdata.io/)
- Graphite
- Grafana
Rewrites
Note: Please keep in mind that hostnames usually contain .. You may want to consider symlinking in the storage directory instead or do rewriting of metrics, as this dashboard uses only the 2nd field for the hostname. eth sub interfaces (like eth0.1) and cgroupplugin needs rewrites as well. A sample configuration for carbon-c-relay is provided above.
carbon-c-relay rewrites
# Rewrite Host
rewrite ^netdata\.([a-z0-9]+)\.example\.com\.
    into netdata.\1_example_com.
    ;
Rewrite network subinterfaces
rewrite ^netdata.([a-z0-9_]+).net.(eth[0-9]+).([0-9]+).
into netdata.\1.net.\2_\3.
;
Fix recursion of cgroup plugin
rewrite ^netdata.([a-z0-9_]+).(cgroup_[a-z0-9_]+).(cgroup_[a-z0-9_]+.)+
into netdata.\1.\2.
;
Storage Schema
Note: As netdata is designed for live views you may want to configure an aligned storage schema that matches netdata's own interval called update every (see this link) as well.
Storage Schema example config
storage-schemas.conf for the default value of netdata's update every (1s):
[netdata]
pattern = ^netdata\.
retentions = 1s:3h
Configuration
- Optional but recommended: deploy provided rewriting
- Optional but recommended: Master-Slave Setup
- Configure netdata to write to Graphite
- Import Dashboard and select the appropriate values at the top variable list for: datasource, rootdir, server.
- Adopt the dashboard's refresh interval to fit your needs.
- Enjoy!
Links
Data source config
Collector config:
Upload an updated version of an exported dashboard.json file from Grafana
| Revision | Description | Created | |
|---|---|---|---|
| Download |

