Prometheus memcached
Prometheus dashboard for memcached servers
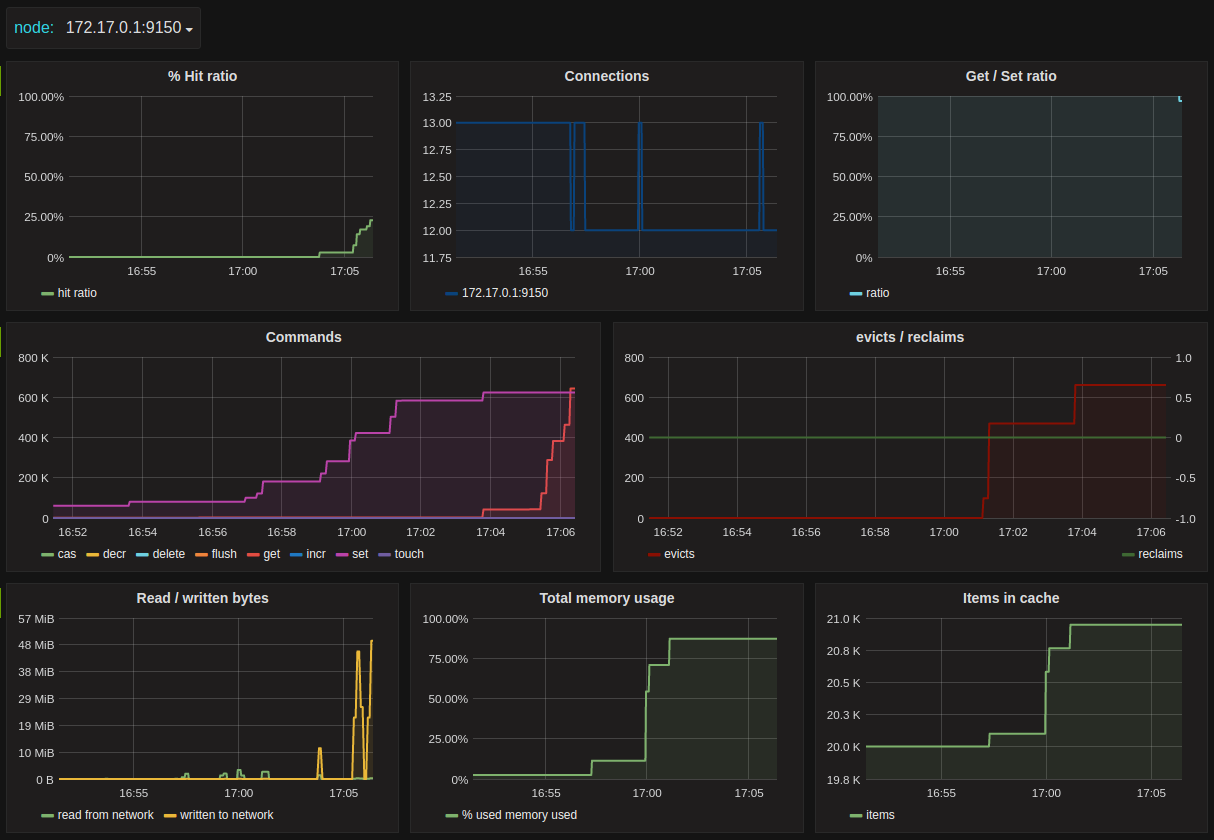
Dashboard for getting a complete overview of your memcached servers using prometheus and memcached_exporter.
Metrics
- % Hit ratio
- Current connections
- Get/set command ratio
- Command usage
- Evict / reclaim
- Network read/write
- Total memory usage
- Items in cache.
This dashboard is based on the metrics created by github.com/prometheus/memcached_exporter using default flags.
Feedback
Comments? suggestions? Please open issues/pull requests to https://github.com/bergquist/dashboards
Data source config
Collector type:
Collector plugins:
Collector config:
Revisions
Upload an updated version of an exported dashboard.json file from Grafana
| Revision | Description | Created | |
|---|---|---|---|
| Download |
Memcached
Easily monitor Memcached, the distributed, in-memory key-value store, with Grafana Cloud's out-of-the-box monitoring solution.
Learn more