Statseeker Interface Details
Overview
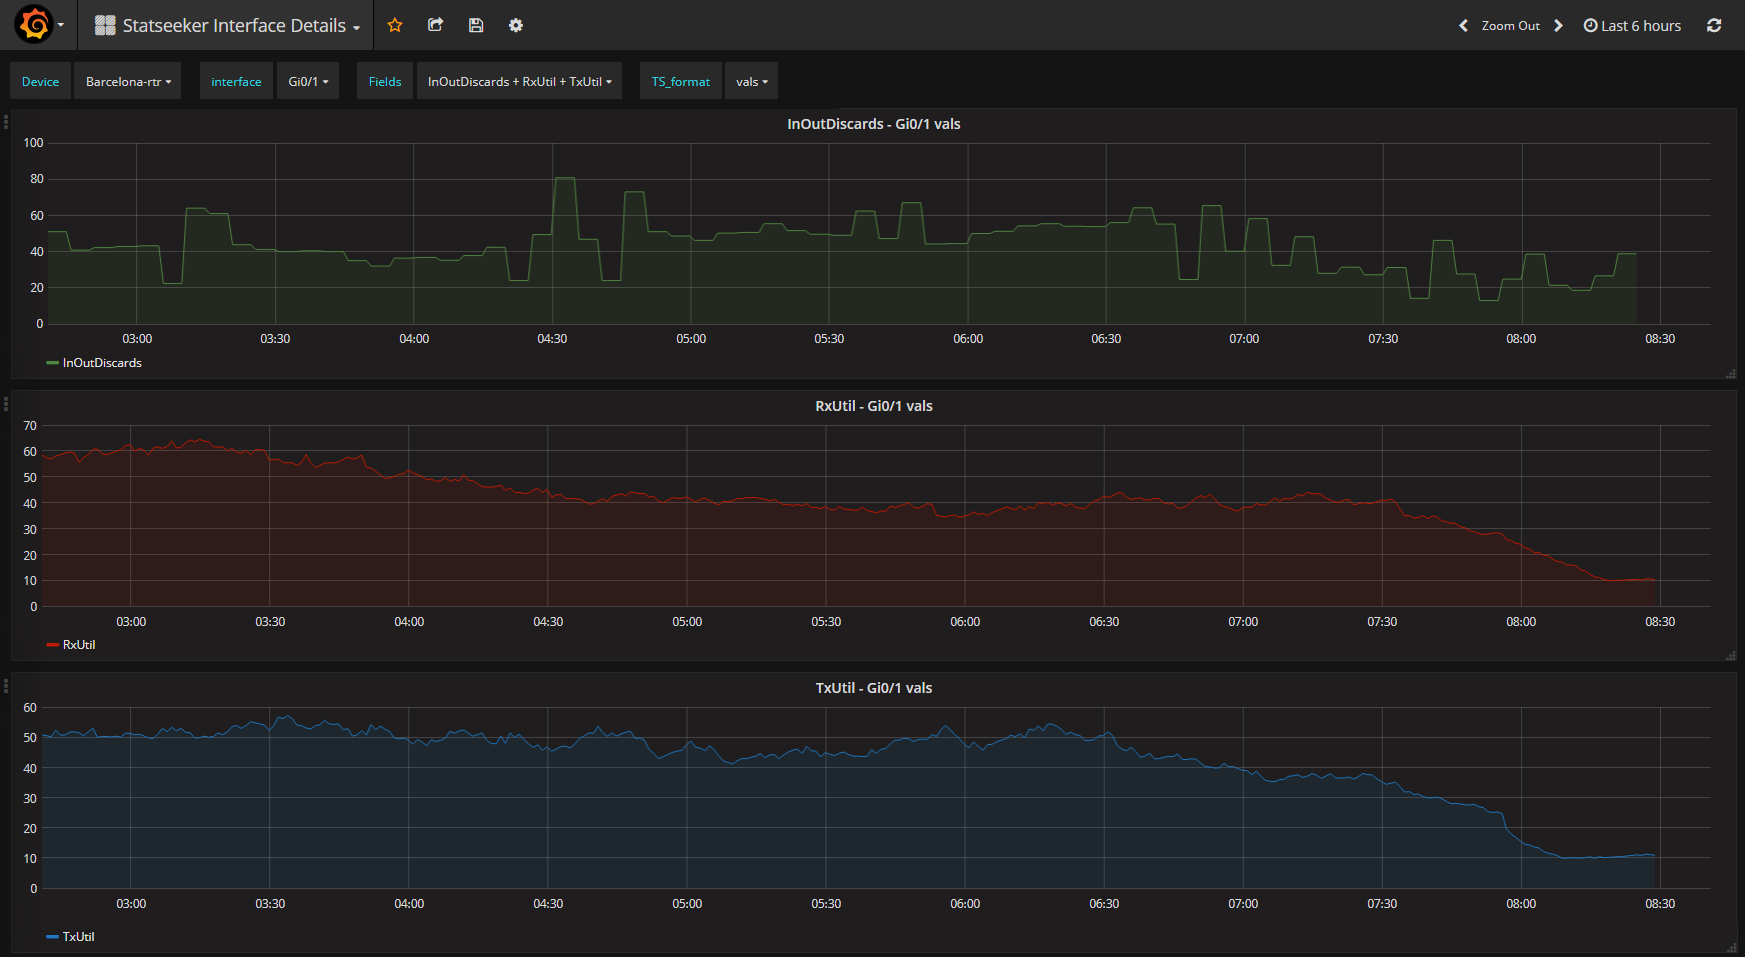
This dashboard duplicates the Statseeker Interface Details report, as seen within the Statseeker product. It is intended as both an example, and a starting point for creating dashboards in Grafana that feature data collected by Statseeker.
Note: this dashboard uses the Statseeker - Grafana Datasource Plugin, see https://github.com/statseeker/grafana-statseeker-datasource for details.
Prerequisites
- A Statseeker v5.2, or later, server
- A Grafana v4.3, or later, server
- A configured Statseeker - Grafana Datasource Plugin, see https://github.com/statseeker/grafana-statseeker-datasource for details
Content
Selective display of any/all of the following interface metrics:
- InBroadcastPkts
- InBroadcastPps
- InErrors
- InMulticastPkts
- InMulticastPps
- InOctets
- InOutBroadcastPkts
- InOutDiscards
- InOutErrors
- InOutMulticastPkts
- InOutOctets
- InOutSpeed
- InOutUcastPkts
- InUcastPkts
- InUcastPps
- OutBroadcastPkts
- OutBroadcastPps
- OutErrors
- OutMulticastPkts
- OutMulticastPps
- OutOctets
- OutUcastPkts
- OutUcastPps
- RxBps
- RxDiscardsPercent
- RxErrorPercent
- RxTxDiscardsPercent
- RxTxErrorPercent
- RxUtil
- TxBps
- TxDiscardsPercent
- TxErrorPercent
- TxUtil
Templates
The dashboard includes templates allowing the user to select:
- Device
- Interface
- Device/Interface Metrics
- Data formats
Data source config
Collector type:
Collector plugins:
Collector config:
Revisions
Upload an updated version of an exported dashboard.json file from Grafana
| Revision | Description | Created | |
|---|---|---|---|
| Download |