
Statseeker Device Viewer
Statseeker Device Viewer
Overview
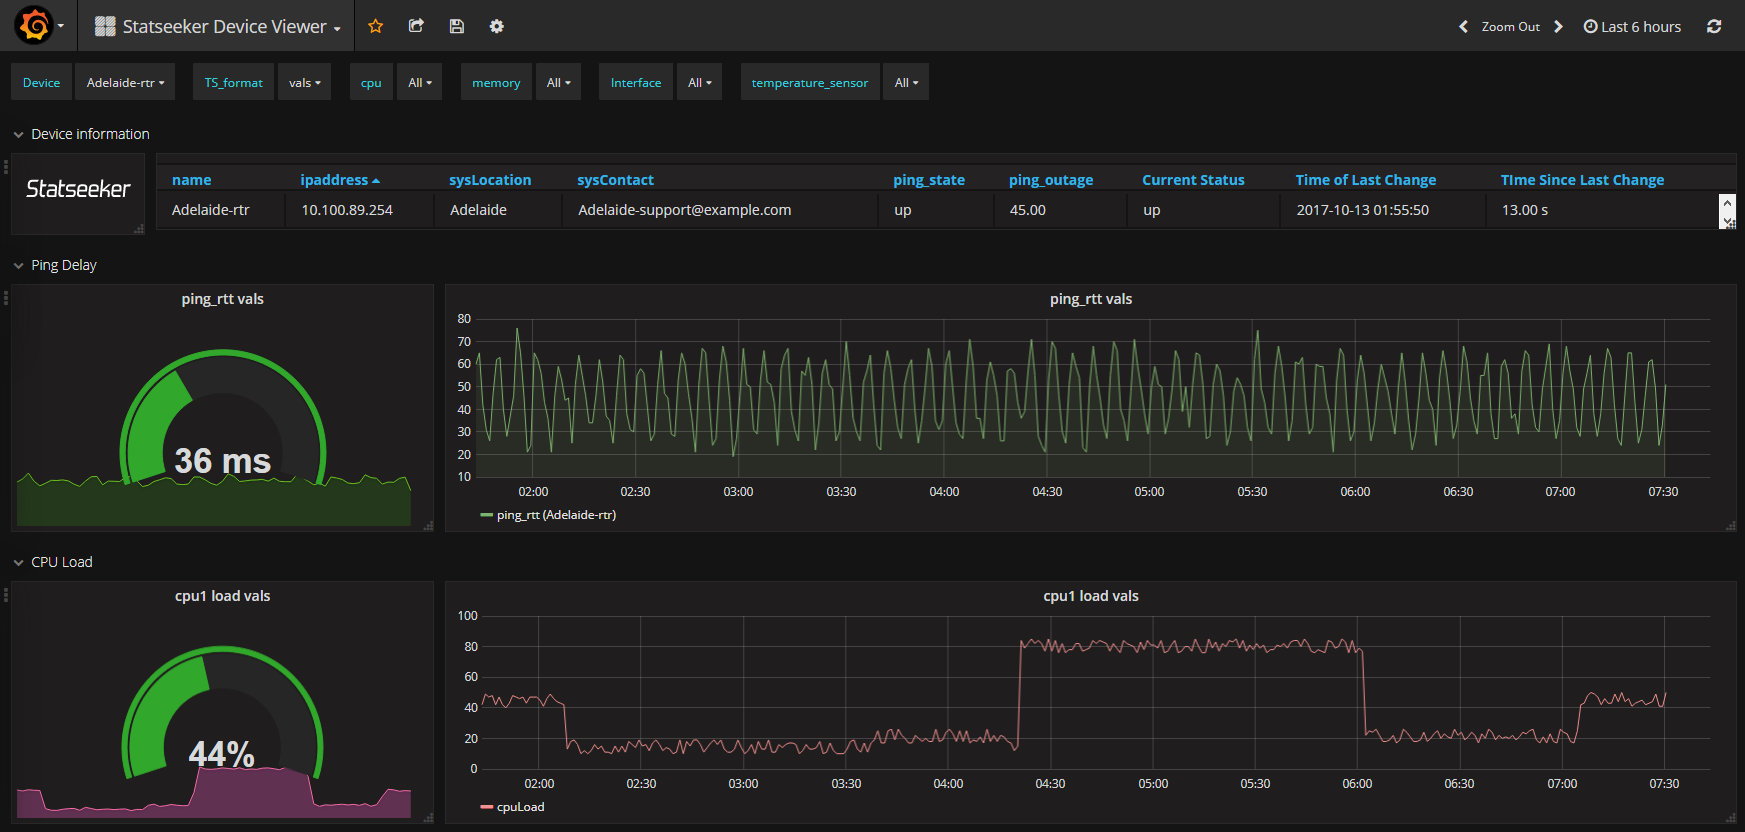
This dashboard duplicates the Statseeker Device Viewer report, as seen within the Statseeker product. It is intended as both an example, and a starting point for creating dashboards in Grafana that feature data collected by Statseeker.
Note: this dashboard uses the Statseeker - Grafana Datasource Plugin, see https://github.com/statseeker/grafana-statseeker-datasource for details.
Prerequisites
- A Statseeker v5.2.x - v5.4.3 server
- A Grafana v4.3 - v5.3.4 server (cannot be installed on the Statseeker server), see https://grafana.com/ for links to download packages and instructions on installation, and basic configuration of Grafana for your environment.
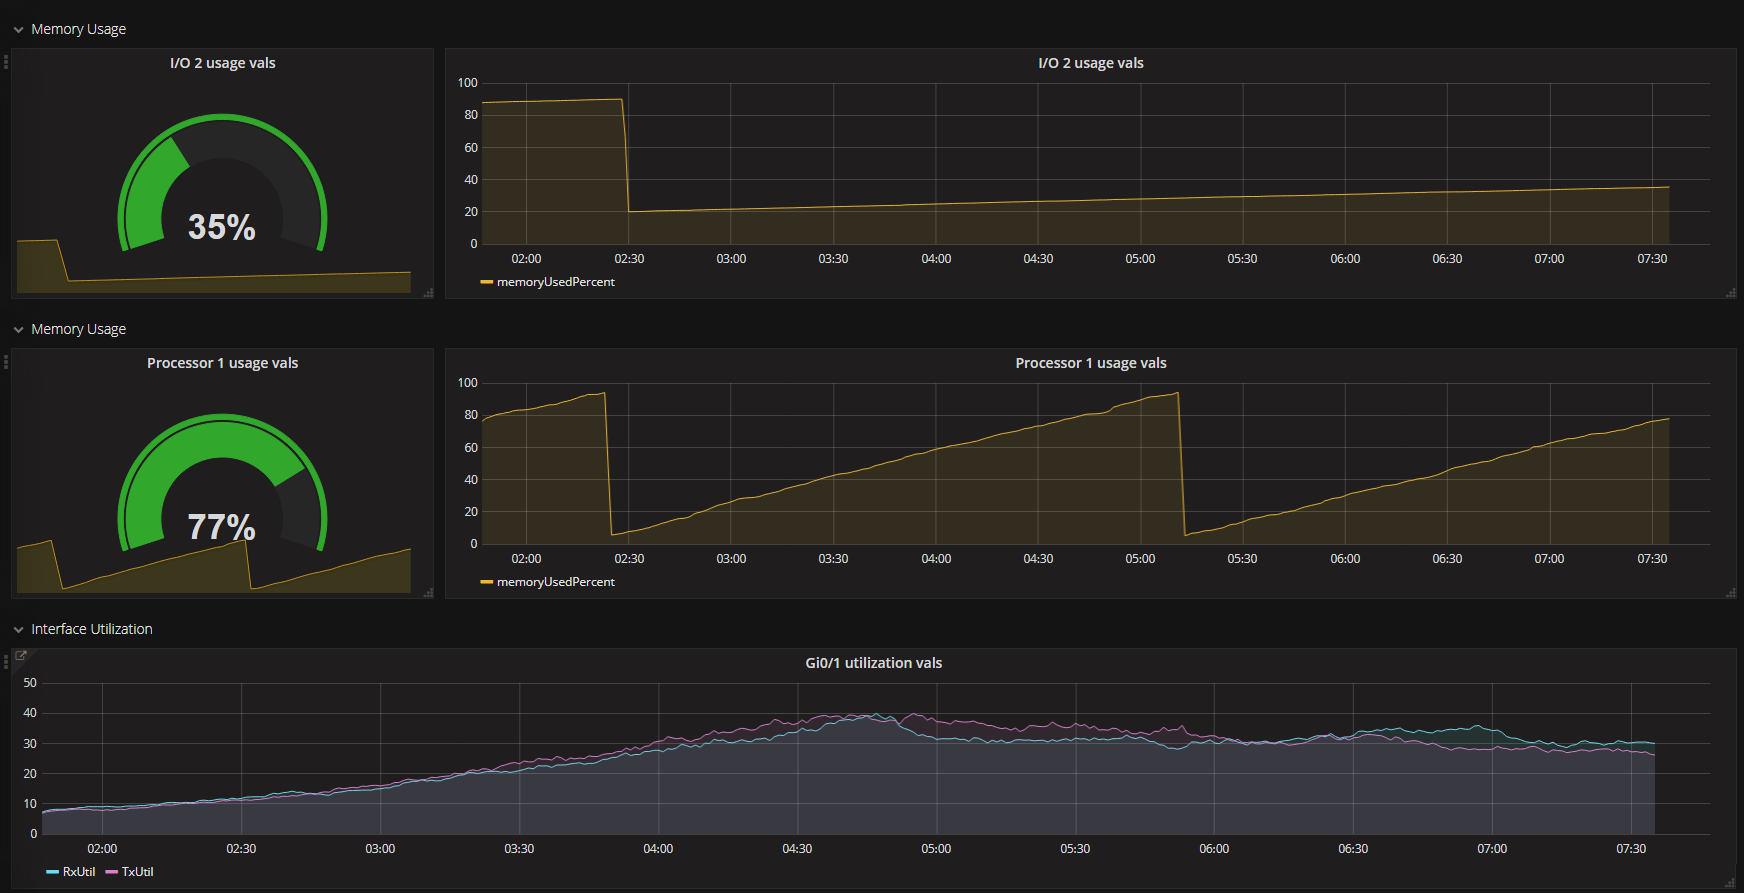
This dashboard features click-through links on interface metric graphs. These links will load that interface in the Statseeker Interface Details dashboard and so require that the Statseeker Interface Details dashboard (https://grafana.com/dashboards/3454) also be installed in order to work.
Content
Display of device information & metrics:
- name
- IP Address
- System Location
- System Contact details
- Ping State
- Time since last state change
- Ping return trip times (graph and gauge)
- CPU Load (graph and gauge)
- Device Temperature (graph and gauge)
- Memory Usage (graph and gauge)
- Rx/Tx Utilization (graphs)
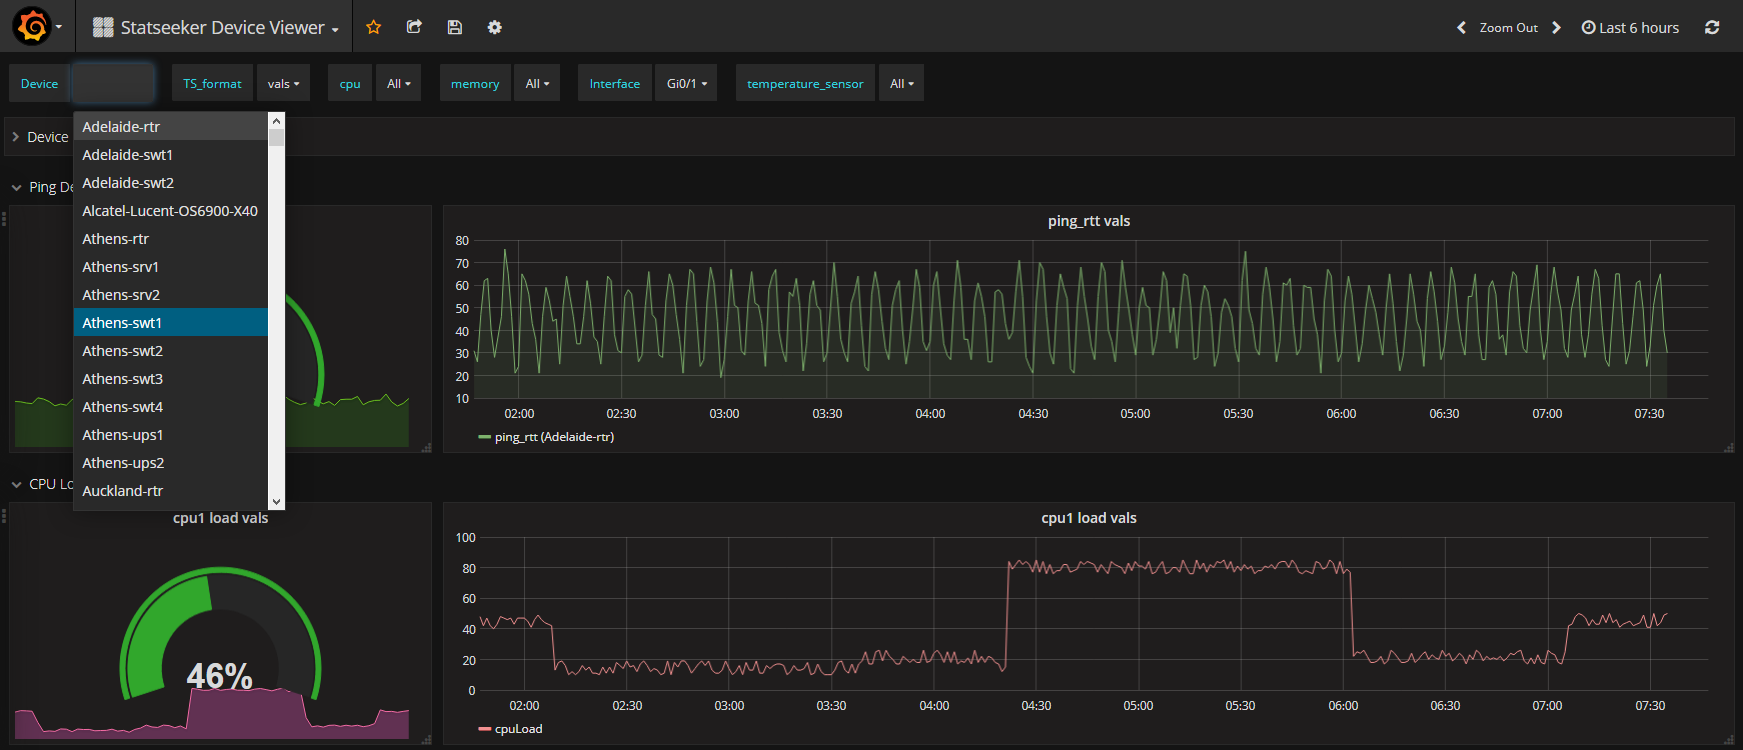
Templates
The dashboard includes templates allowing the user to select:
- Device
- Data formats
- Device CPU/s
- Device memory
- Interface/s
- Temperature sensor/s
Data source config
Collector config:
Dashboard revisions
Upload an updated version of an exported dashboard.json file from Grafana
| Revision | Decscription | Created | |
|---|---|---|---|
| Download |
Get this dashboard
Data source:
Dependencies: