Zimbra Collaboration
Zimbra Dashboard by Jorge de la Cruz (jorgedelacruz.es)
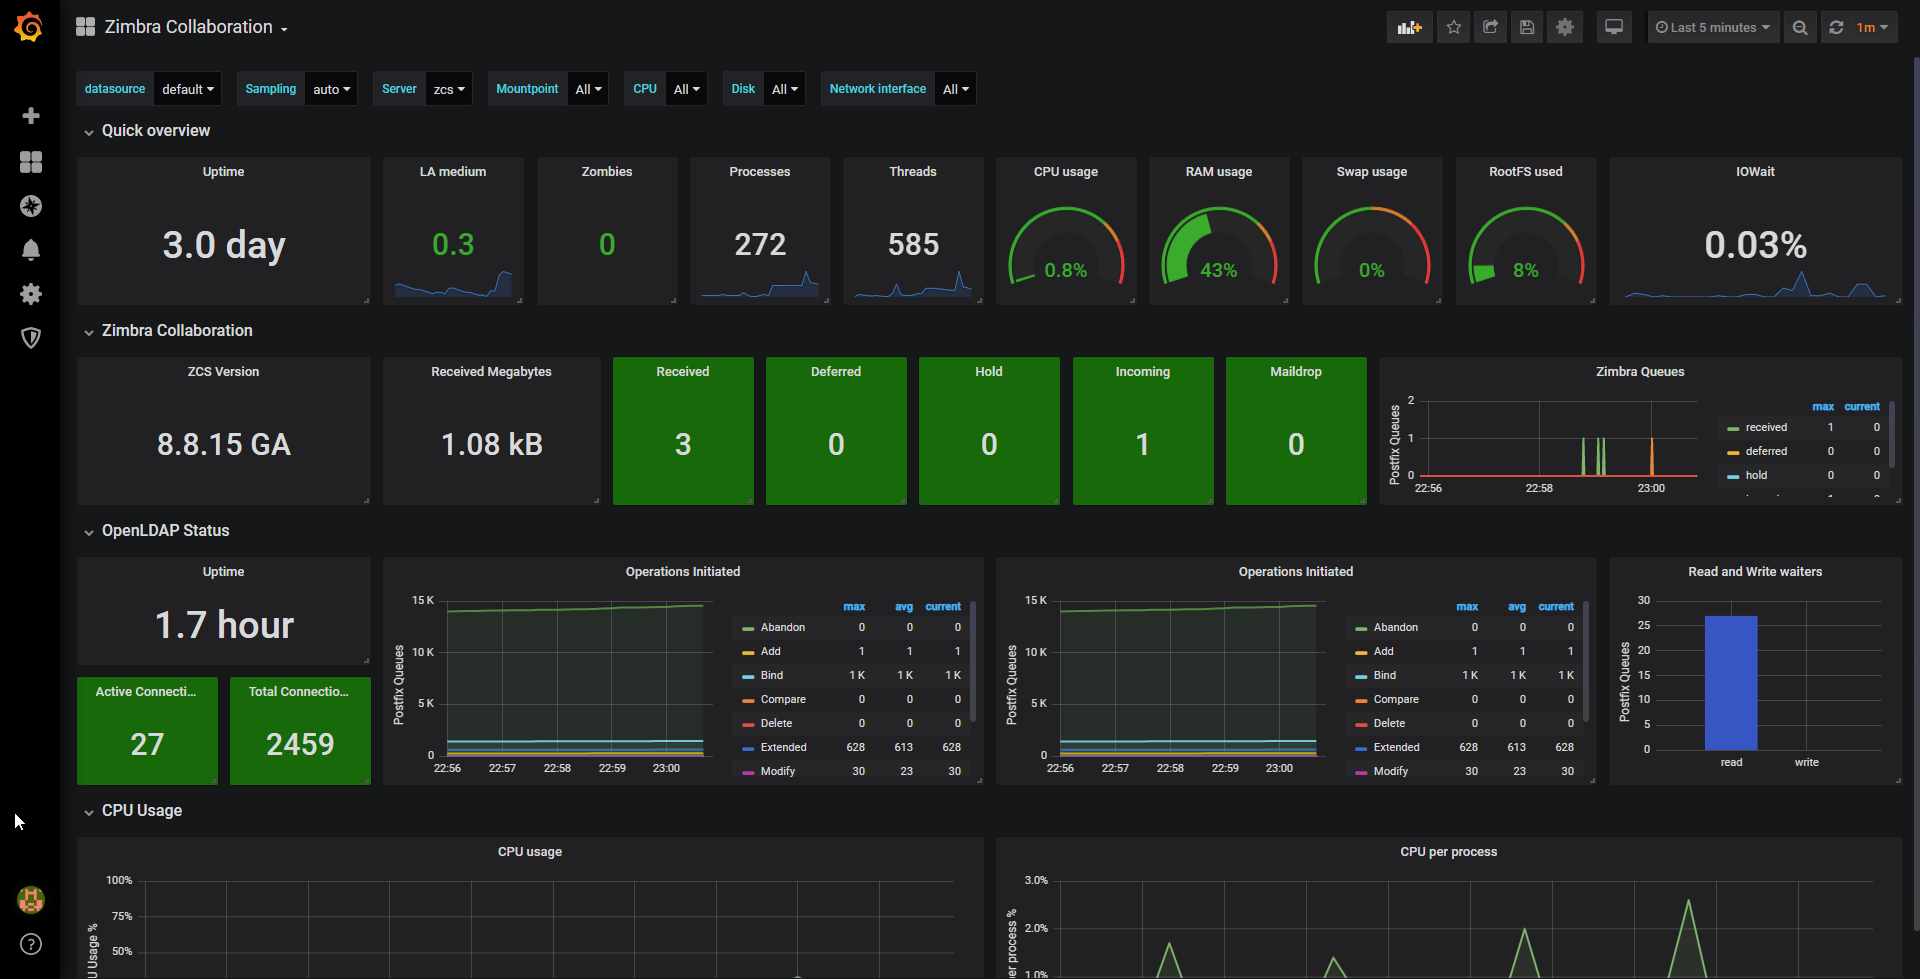
This dashboard contains multiples sections with the goal to monitor a full Zimbra Collaboration Server or Servers, we have some sections to monitor the Linux and machine overall performance, and one dedicated section just to monitor Zimbra Collaboration. Special thanks to Lex Rivera for his Linux System dashboard

Download the checkzimbraversion.sh scripts from the GitHub repository and save it on the next path:
/opt/zimbra/common/bin/checkzimbraversion.sh
chmod +x /opt/zimbra/common/bin/checkzimbraversion.sh
More information available in: https://github.com/jorgedlcruz/zimbra-grafana
Zimbra Collaboration Performance
- ZCS Version (Only 8.7 and above)
- Received Megabytes
- Total Emails/received
- Deferred
- Held
- Incoming
- Maildrop
Linux and machine performance:
- CPUs (defaults to all)
- Disks (per-disk IOPS)
- Network interfaces (packets, bandwidth, errors/drops)
- Mountpoints (space / inodes)
Coming next
This is just a v0.3 of this Dashboard, the next step will be to use the Zimbra SOAP API to obtain some extra information from the Zimbra Collaboration Environment, like:
- Number of Active Users
- Number of Inactive Users
- Number of Domains
- Number of Users with ActiveSync
- etc.
In next versions we will parse directly the logs and put the attempts of logins, and successful logins on a map.
Data source config
Collector config:
Upload an updated version of an exported dashboard.json file from Grafana
| Revision | Description | Created | |
|---|---|---|---|
| Download |