Internet Uptime Monitor
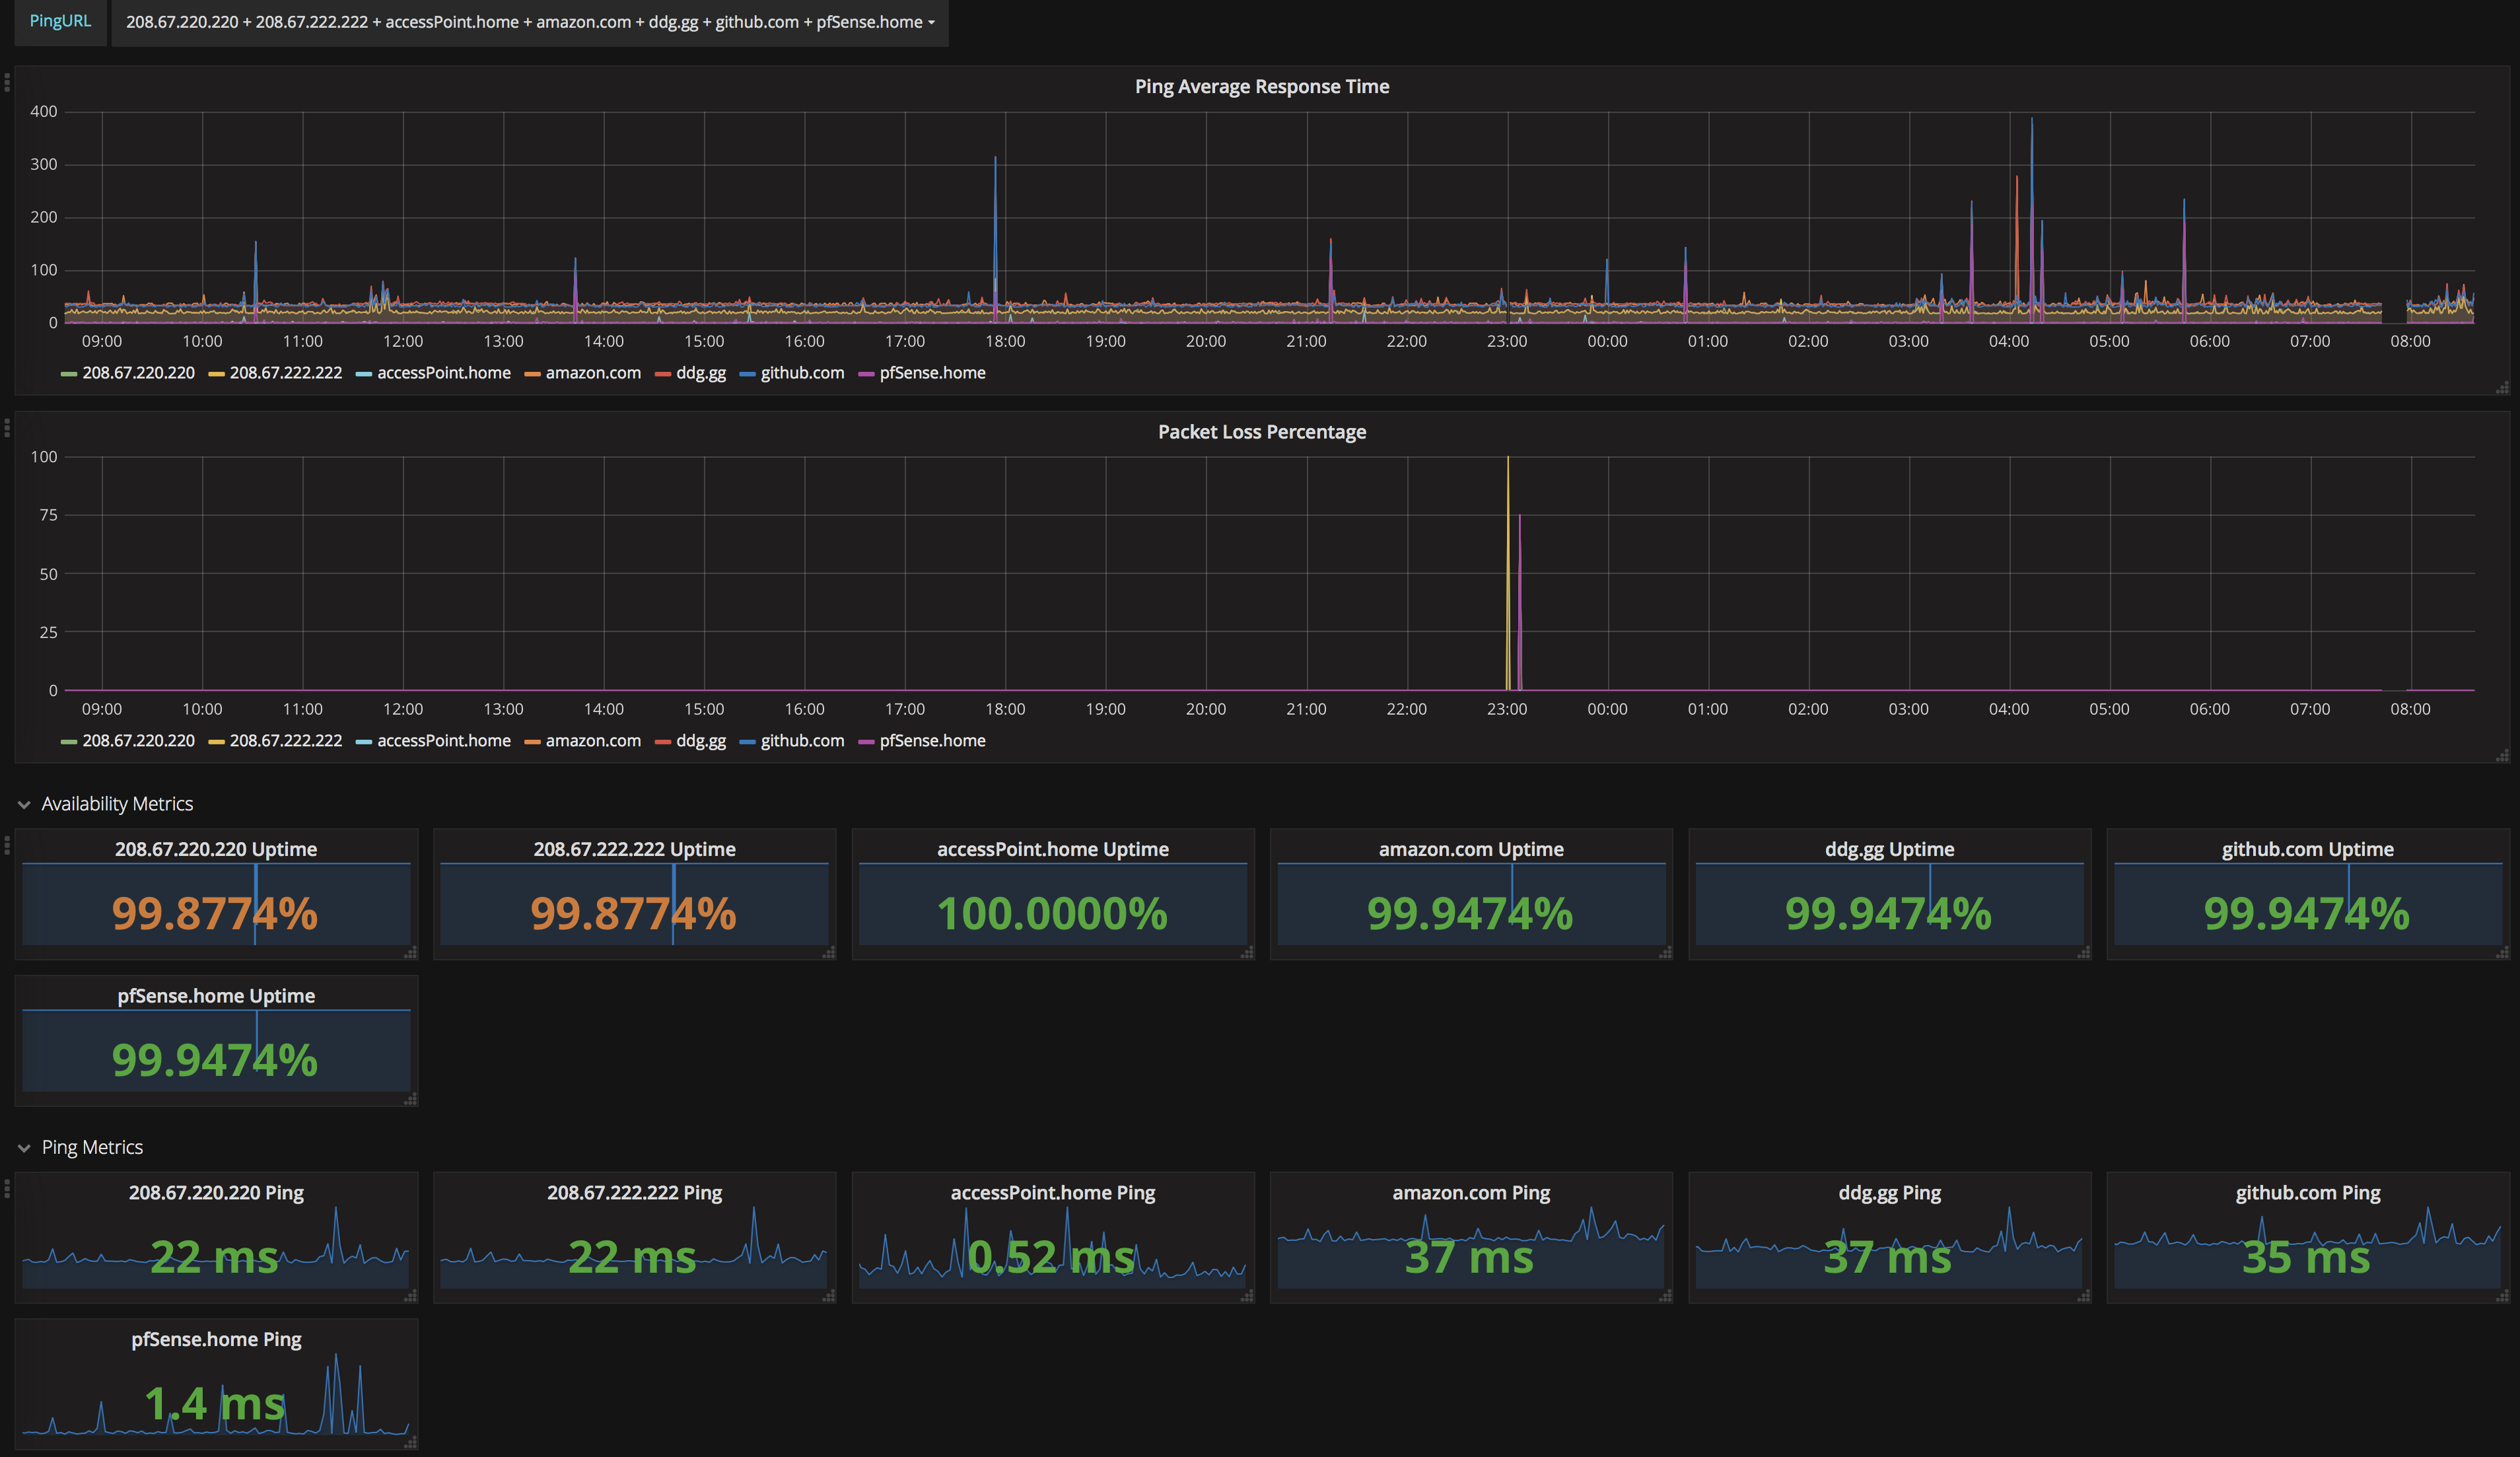
Someone please critique my math on the uptime widgets, because according to http://ezutc.com I am slightly off. (Revision 2: Changed to just subtract the mean packet loss percentage from 100)
Installation:
- Setup Telegraf ping input as described in the collector config.
- Setup InfluxDB
- Setup Telegraf to output to InfluxDB
- Setup Grafana, import dashboard, and enjoy!
Data source config
Collector type:
Collector plugins:
Collector config:
Revisions
Upload an updated version of an exported dashboard.json file from Grafana
| Revision | Description | Created | |
|---|---|---|---|
| Download |