SMAP AI RECON CENTER
AI-powered attack surface intelligence dashboard for passive reconnaissance and cyber threat analysis. Monitor internet-exposed assets through Shodan intelligence, identify vulnerabilities, analyze CVE exposure, track technology stacks, fingerprint services, assess risk levels, and generate AI-assisted security insights with Ollama.
AI-powered passive network reconnaissance and threat intelligence dashboard for Smap — a Shodan InternetDB-based Nmap alternative — with SQLite-backed enrichment, Grafana visualization, and optional local AI analysis via Ollama.
Smap performs passive reconnaissance with zero contact to targets and can scan ~200 hosts/second using Shodan's free InternetDB API. Results are imported into a local SQLite database through a Python enrichment pipeline that extracts CVSS scores, severity levels, CPE-based technology fingerprints, SSL/TLS certificate metadata, geo-enrichment, and auto-generated host tags. An optional AI layer adds host-level threat interpretation, executive summaries, and contextual recommendations. This dashboard visualizes the full pipeline.
Dashboard Overview
This dashboard provides 40+ panels across ** operational sections** plus an AI analysis section, with interactive filters for rapid threat triage, asset visibility, and scan-over-scan comparison.
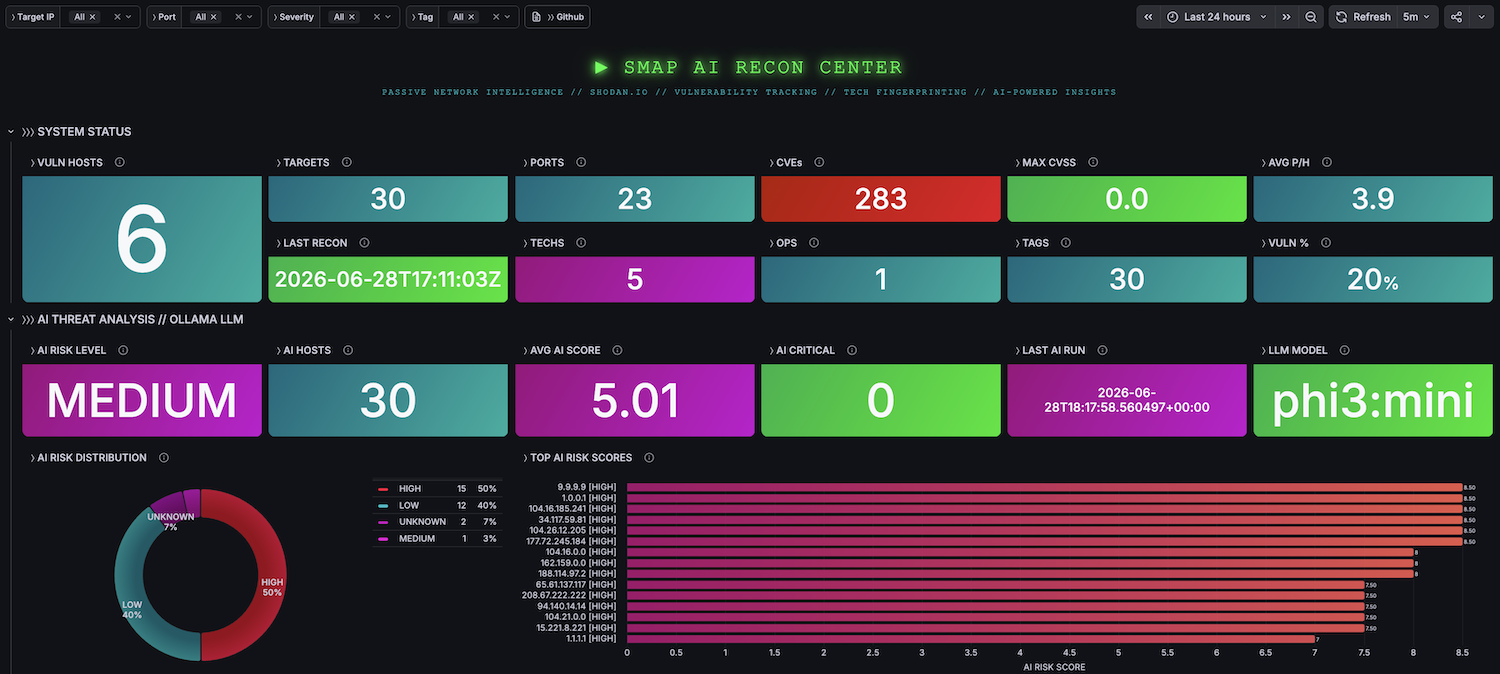
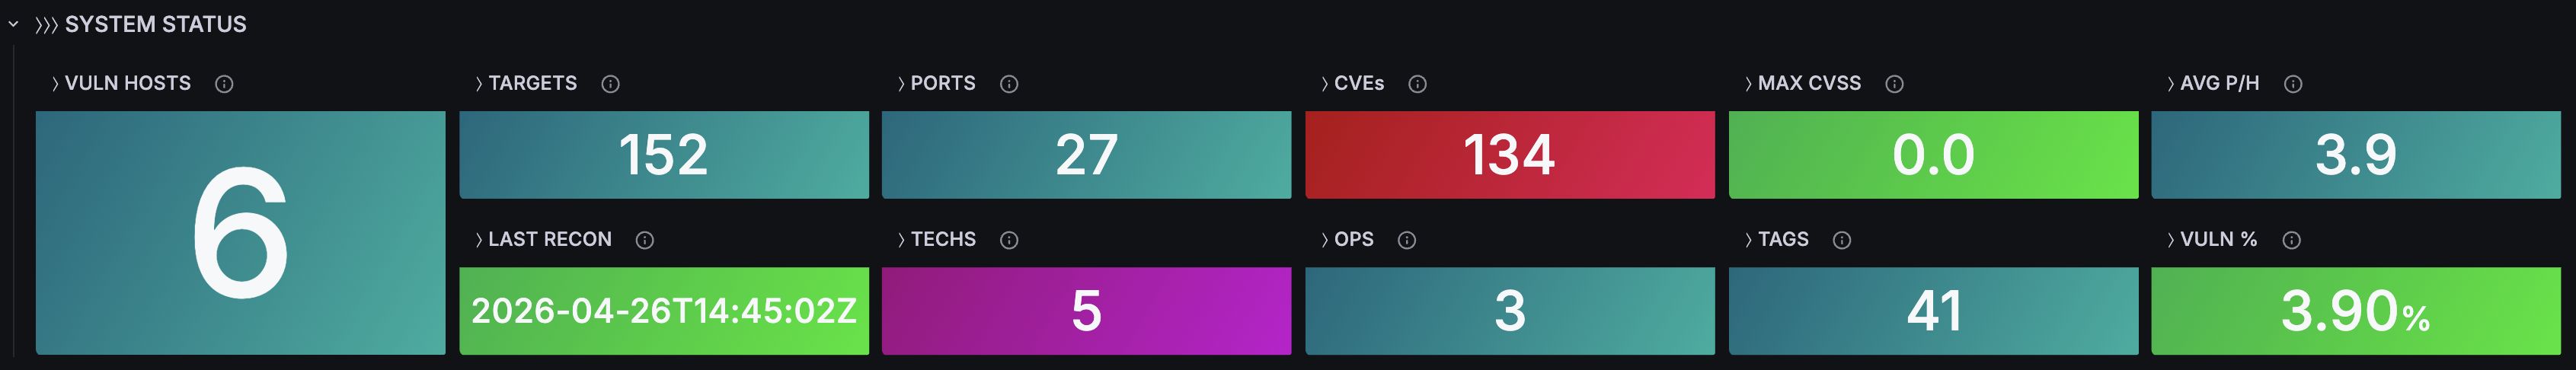
SYSTEM STATUS
Real-time KPIs for the current scan state.
- Last recon timestamp
- Total scan operations
- Unique targets matching filters
- Distinct open ports
- Vulnerable hosts
- Unique CVEs
- Distinct technologies detected from CPE parsing
- Host tag coverage
- Vulnerability ratio
- Maximum CVSS score
- Average open ports per host
THREAT MATRIX
Risk-focused vulnerability analysis and prioritization.
- Host Threat Index — sortable table with IP, vulnerability count, max CVSS, risk level, organization, and ports
- Severity Breakdown — donut chart of vulnerabilities by severity
- Exploit Frequency — top recurring CVEs
- Risk Levels — host distribution by computed risk level
- Blast Radius — CVEs ranked by number of affected hosts
- Exploit Database — filterable CVE ↔ IP ↔ CVSS ↔ Severity ↔ Port ↔ Service table with NVD deep-links
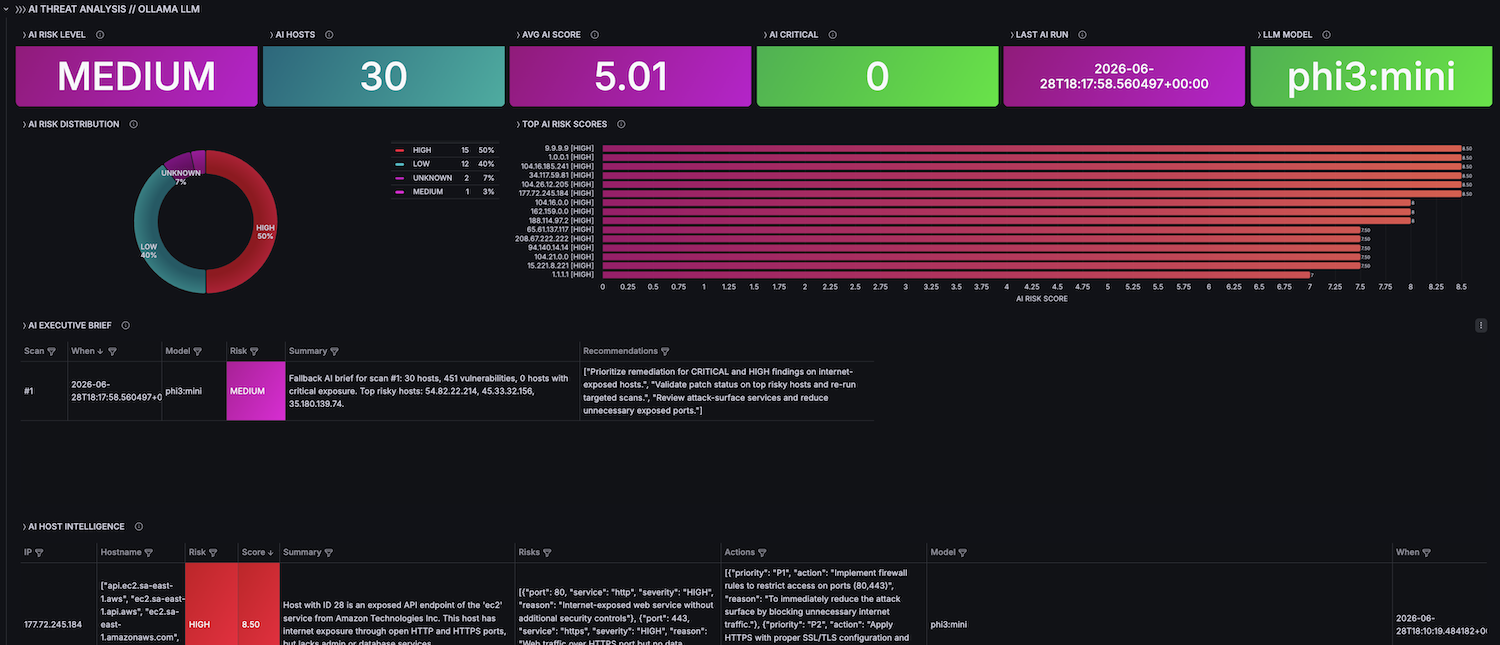
AI THREAT ANALYSIS
AI-assisted host prioritization, contextual risk interpretation, and executive summaries powered by Ollama.
- AI Risk Level — overall AI-assessed risk level for the latest analyzed scan
- Hosts Analyzed — number of hosts processed by the AI engine
- AI High+Crit — hosts classified by AI as high or critical risk
- Average AI Score — average AI-generated host risk score
- AI Model — model used for the latest analysis
- Last AI Run — timestamp of the latest AI analysis
- AI Executive Summary — scan-level contextual summary and recommendations
- AI Risk Distribution — host distribution by AI-generated risk level
- AI vs Static Risk — comparison between importer-computed risk and AI interpretation
- AI Host Threat Index — ranked table with host, AI risk, score, summary, and recommended actions
- AI Assessment History — historical AI summaries, risk levels, models, and recommendations
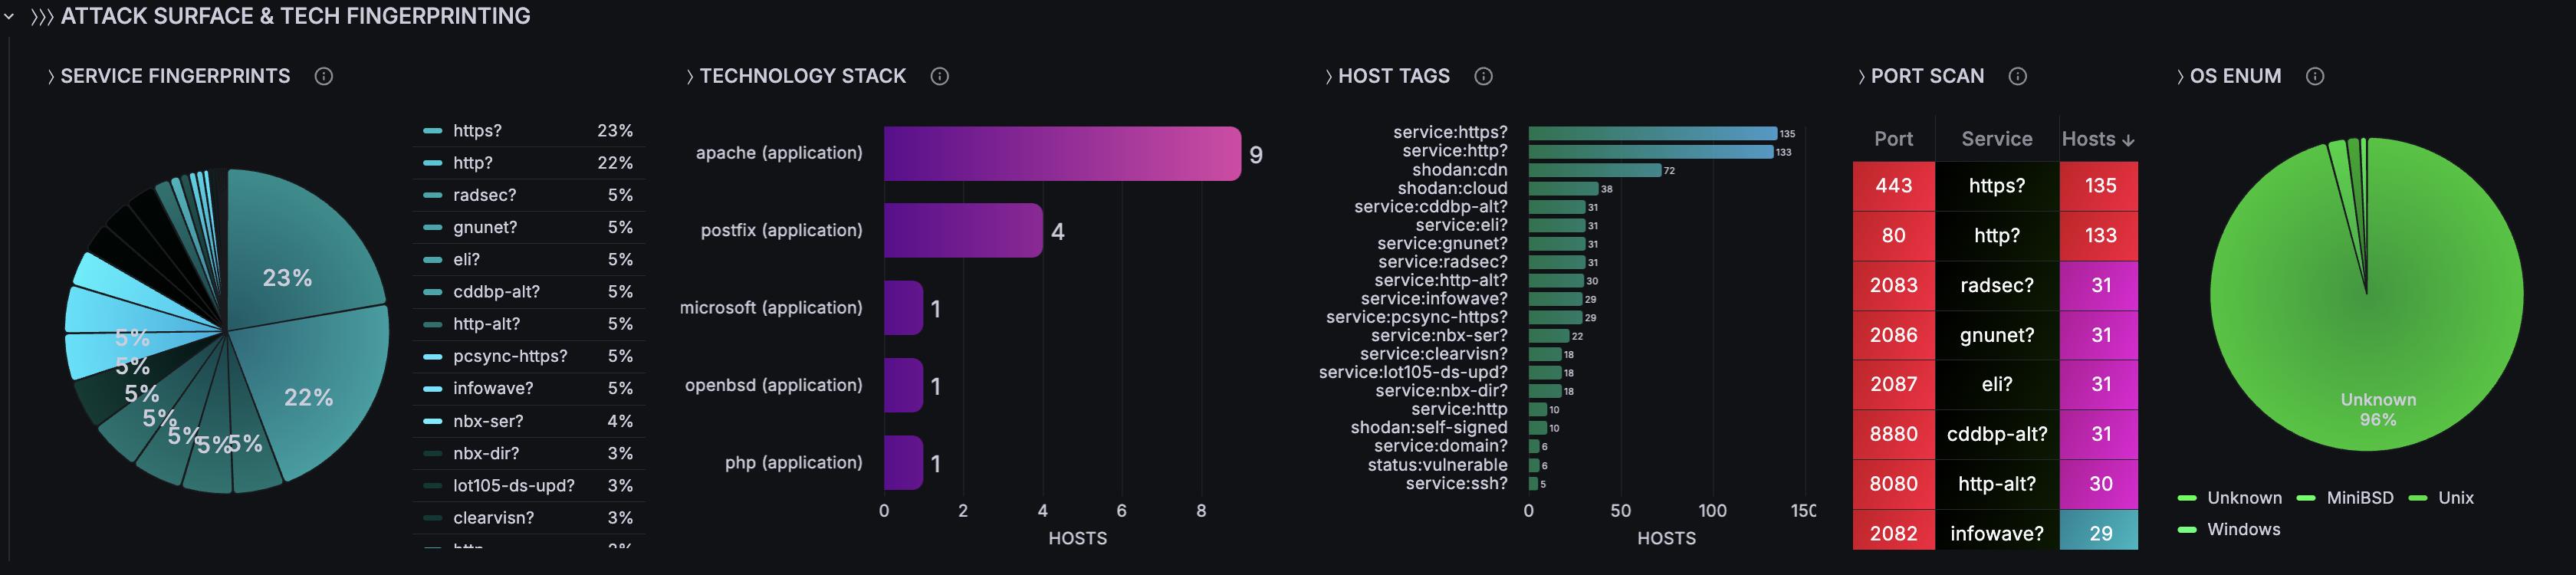
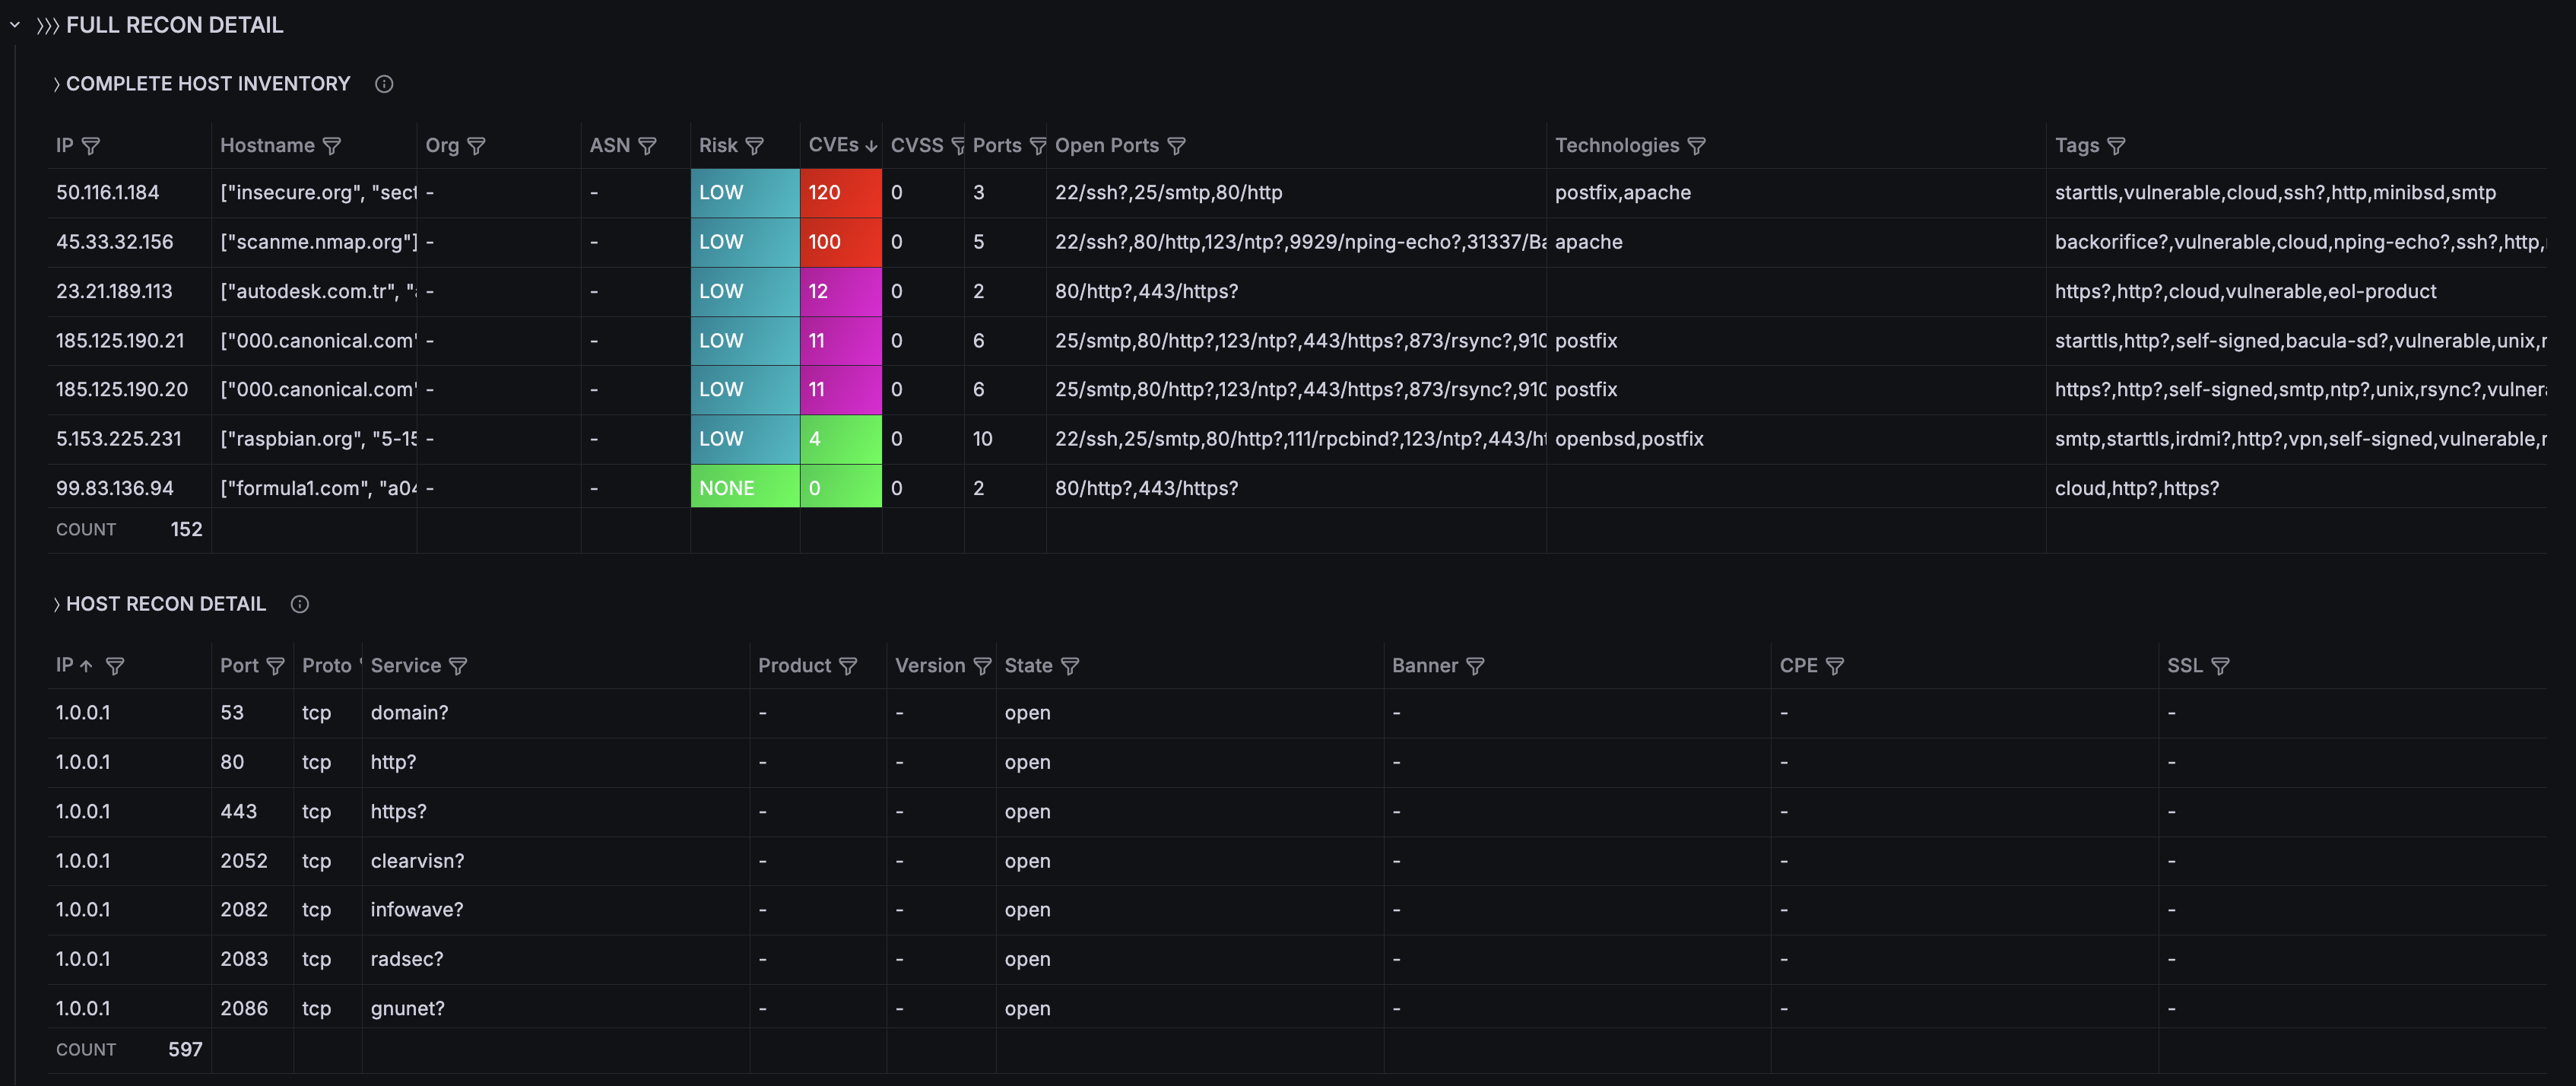
ATTACK SURFACE & TECH FINGERPRINTING
Service enumeration, technology profiling, and infrastructure visibility.
- Service Fingerprints — service/product distribution
- Technology Stack — technologies ranked by host count from CPE parsing
- Host Tags — auto-tag distribution by source (
shodan,os,service,status) - Port Scan — port/service/host count table
- OS Enumeration — operating system distribution
- Complete Host Inventory — IP, hostname, org, ASN, risk level, CVEs, CVSS, ports, technologies, tags
- Host Recon Detail — per-port detail including product, version, banner, CPE, and SSL/TLS indicators
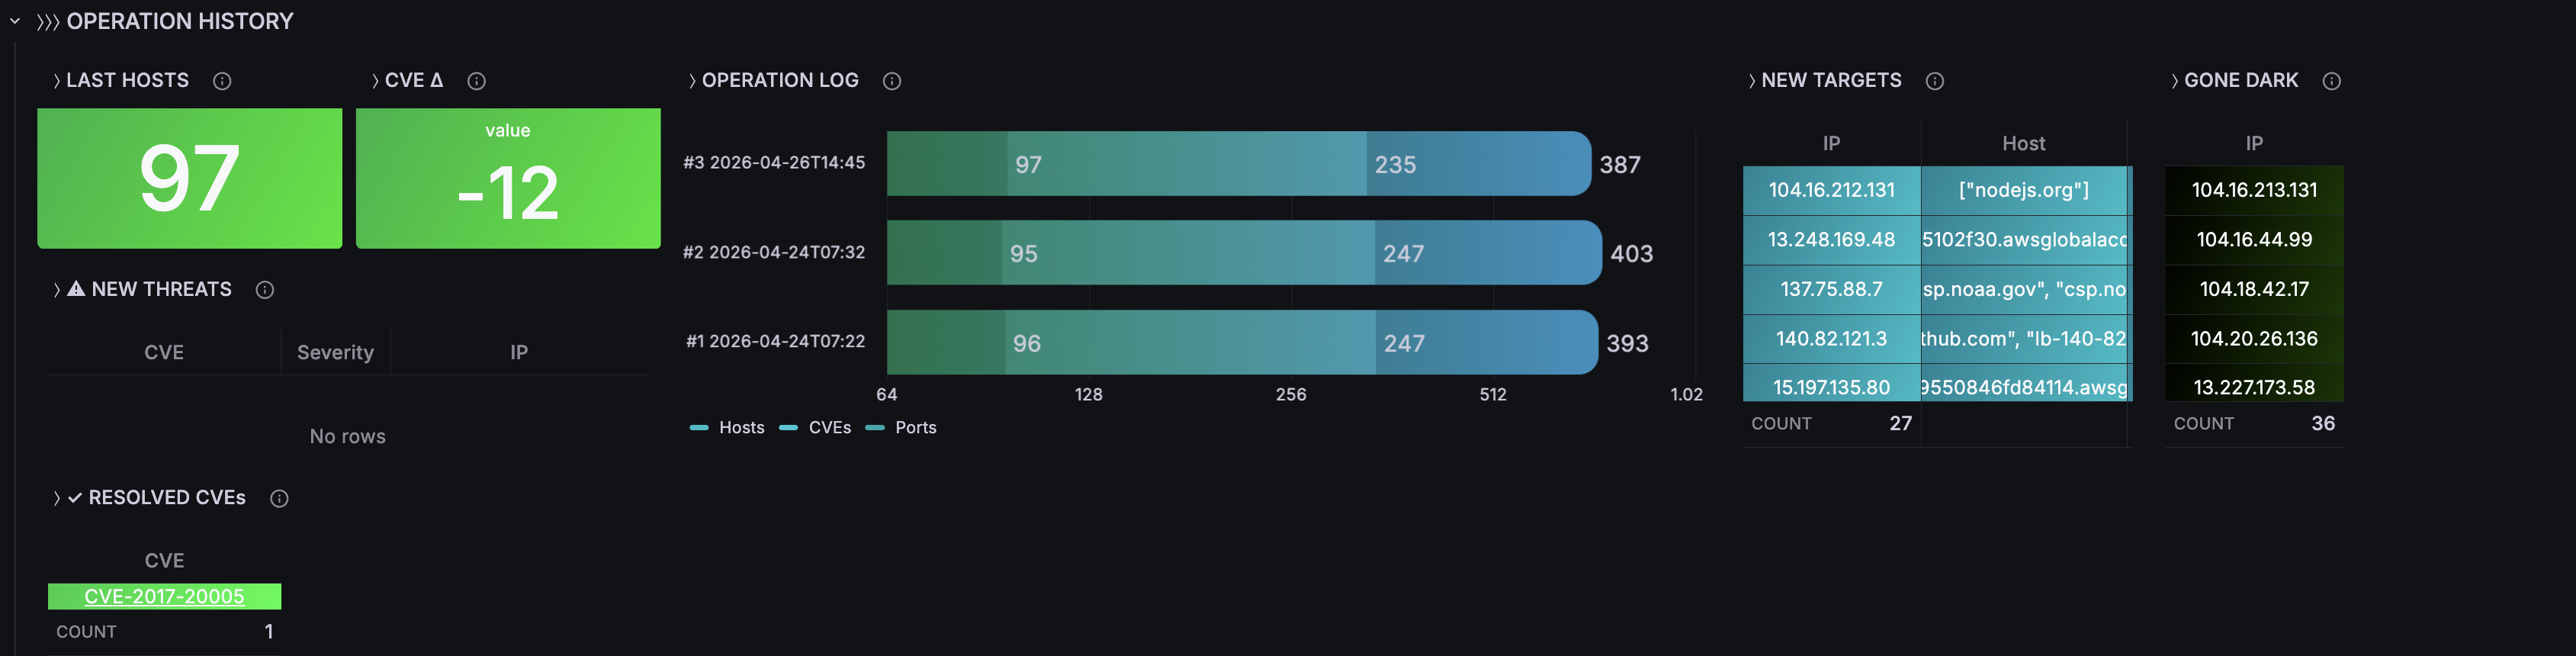
OPERATION HISTORY
Historical scan comparison and drift tracking.
- Operation Log — hosts / CVEs / ports by scan
- New Targets — IPs seen for the first time
- Gone Dark — hosts missing from the latest scan
- New Threats — CVEs newly detected in the latest scan
- Resolved CVEs — vulnerabilities no longer present
- CVE Delta — vulnerability count change between scans
Filter Variables
All panels react in real time to the following filters:
- Target IP (multi-select)
- Port (multi-select)
- Severity (
CRITICAL,HIGH,MEDIUM,LOW,UNKNOWN) - Tag (for example:
vulnerable,ssl/tls,http, etc.)
Data Model
Core SQLite tables
- scans — scan metadata and aggregate totals
- hosts — IP, hostname, OS, geo, org, ASN, vuln_count, max_cvss, risk_level
- ports — port, protocol, service, product, version, banner, CPE, SSL/TLS details
- vulnerabilities — CVE, CVSS, severity, summary, references
- technologies — CPE-parsed technology data: category, name, version
- host_tags — generated host tags with source attribution
AI additive tables
- ai_scan_analysis — scan-level AI summaries, risk level, recommendations
- ai_host_analysis — host-level AI risk score, summary, key risks, and actions
CVSS Severity Classification
- CRITICAL: 9.0–10.0
- HIGH: 7.0–8.9
- MEDIUM: 4.0–6.9
- LOW: 0.1–3.9
- NONE: 0.0
- UNKNOWN: no score available
Requirements
- Docker 20.x+ and Docker Compose v2
- No Shodan API key required
- SQLite datasource plugin:
frser-sqlite-datasource - Optional local AI analysis with Ollama
- Typical deployment time: ~2 minutes
Quick Start
git clone https://github.com/czantoine/smap-ai-recon-center
cd smap-ai-recon-center/quickstart
docker compose up -d --build
Data source config
Collector config:
Upload an updated version of an exported dashboard.json file from Grafana
| Revision | Description | Created | |
|---|---|---|---|
| Download |