Grafana 11 release: The latest in visualizations, Scenes-powered dashboards, simple access controls,...
Learn about all the latest features in the Grafana 11 release.
Read more
Open Source
Community resources
Dashboard templates
Try out and share prebuilt visualizations
Prometheus exporters
Get your metrics into Prometheus quickly
end-to-end solutions
Opinionated solutions that help you get there easier and faster
monitor infrastructure
Out-of-the-box KPIs, dashboards, and alerts for observability
visualize any data
Instantly connect all your data sources to Grafana
Docs
Get started
Get started with Grafana
Build your first dashboard
Get started with Grafana Cloud
What's new / Release notes
Opinionated solutions that help you get there easier and faster
Instantly connect all your data sources to Grafana
Getting started with the Grafana LGTM Stack
We’ll demo how to get started using the LGTM Stack: Loki for logs, Grafana for visualization, Tempo for traces, and Mimir for metrics.
I am Grot. Ask me anything
Write a short description about your experience with Grot, our AI Beta.
Rate your experience (required)
Learn about all the latest features in the Grafana 11 release.
Read more
Learn about all the latest features in Grafana Loki 3.0.
Read more
All your questions about migrating from Grafana Agent to Grafana Alloy answered
Read more
Grafana Alloy is a telemetry collector that is 100% OTLP compatible and offers native pipelines for OpenTelemetry and Prometheus telemetry...
Read more
Legacy alerting will be removed from Grafana on May 14. Learn how to easily upgrade to Grafana Alerting before it's too late
Read more
Simplified routing is a powerful, yet easy-to-use, new feature in Grafana Alerting that dynamically routes alerts and enforces RBAC.
Read more
Learn about workflow changes we've made to our on-call management tool to reduce redundancies and context switching so you can identify and respond to...
Read more
An incident response process outlines the steps your team needs to take when an incident occurs. Use the tips and cheat sheet in this post to help...
Read more
Learn how to automate image analysis — a previously time-intensive and manual task — with ChatGPT’s vision API and Grafana Cloud Metrics.
Read more
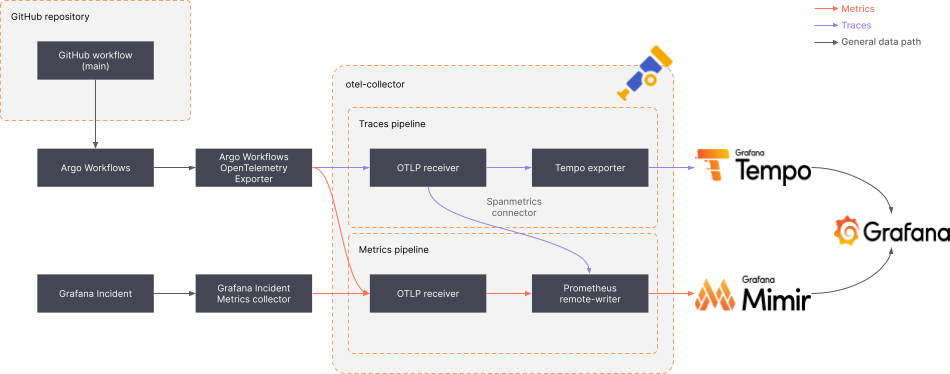
Building on existing efforts to improve CI/CD observability, a Grafana Labs hackathon team built a POC for extracting DORA metrics from CD workflows.
Read more
With a new GitHub Action developed by the Grafana Labs Security Operations team, you can automate the validation of Sigma rules and enhance your...
Read more
Learn about some of the recently added visualization capabilities in Grafana that make it easier to surface trends in your data.
Read more
Beyla 1.3 delivers OpenTelemetry distributed tracing support through two approaches: automatic header injection and black-box context propagation.
Read more
Using an agent isn't always feasible when working with serverless architectures, IoT systems, or batch jobs. Learn how to use an HTTP API to send your...
Read more
All of this month's latest and greatest features in the fully managed Grafana Cloud observability platform
Read more