Grafana Loki 3.3 release: faster query results via Blooms for structured metadata
The Grafana Loki 3.3 release is here, and it brings a fresh wave of enhancements aimed at making your log management experience faster, more...
Read more
Technical articles, how-to guides, tips, and tricks from our R&D team
Featured engineering posts
The Grafana Loki 3.3 release is here, and it brings a fresh wave of enhancements aimed at making your log management experience faster, more...
Read more
Grafana 11.3 marks the general availability of Scenes-powered dashboards plus introduces more features and functionality to improve your dashboarding...
Read more
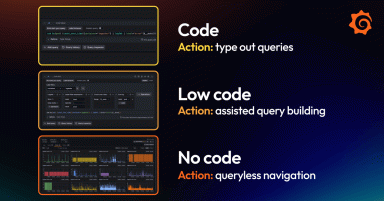
From complex queries to queryless explorations, everyone—from beginners to experts—can get value out of their telemetry data and realize the full...
Read more
We’re looking for speakers at GrafanaCON to share your real-world experiences with Grafana, from quirky and unexpected use cases to cool dashboards to...
Read more
In the spirit of the new year, here’s a look back at some recent OpenTelemetry project milestones, as well as a peek at what’s to come in 2025.
Read more
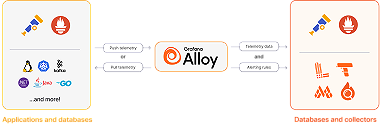
Check out these handy tips and demos from Grafana Labs experts about how to send and receive telemetry with Grafana Alloy.
Read more
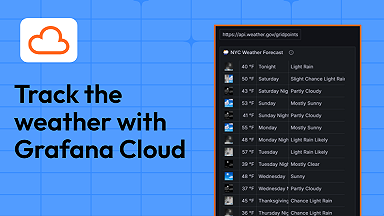
New to Grafana Cloud? Learn how to quickly transform raw JSON data into a dashboard with this simple, step-by-step example.
Read more
In line with our big tent philosophy, the Grafana LLM plugin has expanded support for open-weights models and non-OpenAI providers.
Read more
2024 was a big year for open source software and the OSS community here at Grafana Labs. Here are some of the highlights.
Read more
From adaptive telemetry to the Explore apps suite, here’s a look back at the big updates we made to Grafana Cloud in 2024.
Read more
In the latest episode of “Grafana’s Big Tent” podcast, observability experts explore tools and best practices to help you reduce resource waste, track...
Read more
With Grafana 11.4, the AWS Cloudwatch data source plugin now supports querying Cloudwatch Logs Insights with OpenSearch PPL and OpenSearch SQL.
Read more
In Grafana Alerting, Grafana-managed recording rules can save you time and effort in setting up and managing your incident response.
Read more
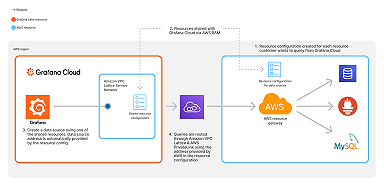
Grafana Cloud users can now establish a private connection using AWS PrivateLink and Amazon VPC Lattice, bypassing the public internet and eliminating...
Read more
Here’s a look back at the big updates we’ve made to Grafana Cloud Synthetic Monitoring this year, including the addition of multiHTTP and k6 scripted...
Read more
Sample four distinct recipes designed to introduce you to different aspects of telemetry data collection and management with OpenTelemetry and Grafana...
Read more
Lower costs, reduced maintenance, centralized tools — observability experts talk about why Grafana Cloud is their hosted platform of choice.
Read more
With OpenTelemetry and Grafana Alloy, it's now easier than ever to send delta samples to cumulative backends such as Prometheus or Grafana Cloud.
Read more

