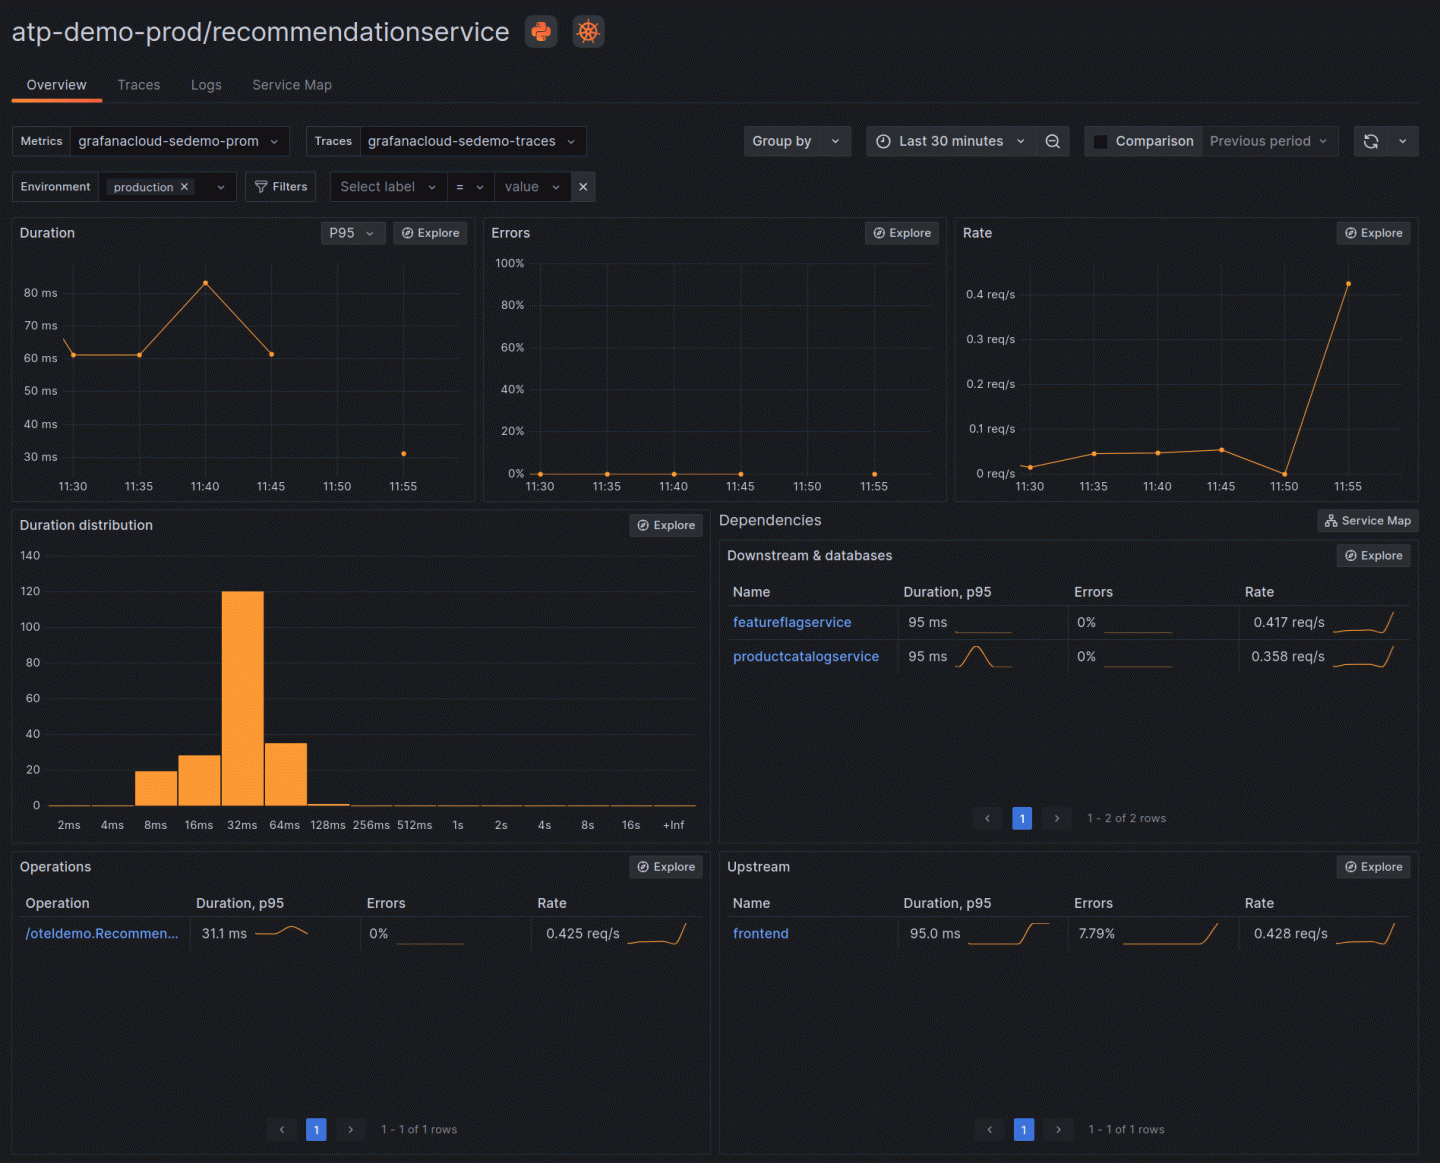
How to instrument your Python application using OpenTelemetry
A complete guide for how to emit OpenTelemetry data from your Python application to Grafana Cloud.
Read more
Open Source
Community resources
Dashboard templates
Try out and share prebuilt visualizations
Prometheus exporters
Get your metrics into Prometheus quickly
end-to-end solutions
Opinionated solutions that help you get there easier and faster
monitor infrastructure
Out-of-the-box KPIs, dashboards, and alerts for observability
visualize any data
Instantly connect all your data sources to Grafana
Docs
Get started
Get started with Grafana
Build your first dashboard
Get started with Grafana Cloud
What's new / Release notes
Opinionated solutions that help you get there easier and faster
Instantly connect all your data sources to Grafana
Getting started with the Grafana LGTM Stack
We’ll demo how to get started using the LGTM Stack: Loki for logs, Grafana for visualization, Tempo for traces, and Mimir for metrics.
I am Grot. Ask me anything
Write a short description about your experience with Grot, our AI Beta.
Rate your experience (required)
A complete guide for how to emit OpenTelemetry data from your Python application to Grafana Cloud.
Read more
When deciding where to host your OpenTelemetry data, be sure to ask these three important questions.
Read more
Whether you're a new user or you manage fleets of containers, troubleshooting issues is easier with the updated alerting experience in Kubernetes...
Read more
Our flagship observability event is on the move again. Here’s an early look at the locations and dates for ObservabilityCON on the Road 2024!
Read more
Today we are releasing Grafana 10.3.3, 10.2.4, 10.1.7, 10.0.11 and 9.5.16, which include a medium severity security fix. If you are affected, we...
Read more
A look back at a decade of dashboarding and the community and innovation that will power the next ten years and beyond
Read more
Mat Ryer, principal engineer at Grafana Labs and host of the Go Time podcast, shares what he's learned from more than a dozen years of writing HTTP...
Read more
Registration for GrafanaCON 2024, our biggest community event of the year, is officially open. Join us live and in person in Amsterdam this April!
Read more
Grafana k6 v0.49.0 is here, featuring a built-in web dashboard for real-time result visualization and tons of other improvements.
Read more
Span Profiles, a new feature in Grafana Cloud and Grafana OSS, enables deeper analysis of both tracing and profiling data for a more granular view of...
Read more
From an open source project to an open observability platform, Grafana has grown to more than 20 million users worldwide. And we're just getting...
Read more
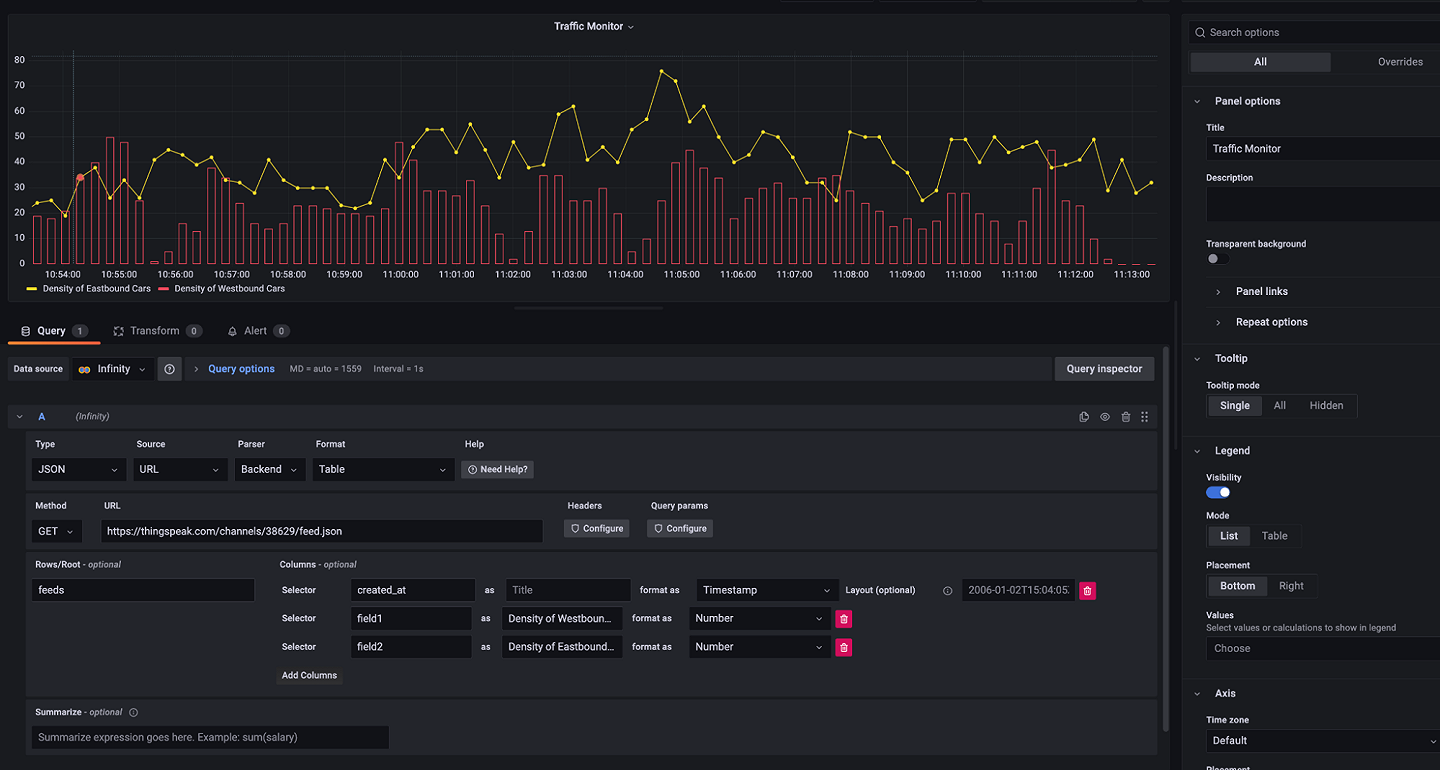
It’s an exciting new chapter for the Infinity data source plugin, which lets you seamlessly visualize data from JSON, CSV, XML, and GraphQL endpoints...
Read more
Your guide to finding and connecting with Grafana Labs at the prominent open source conference in Brussels.
Read more
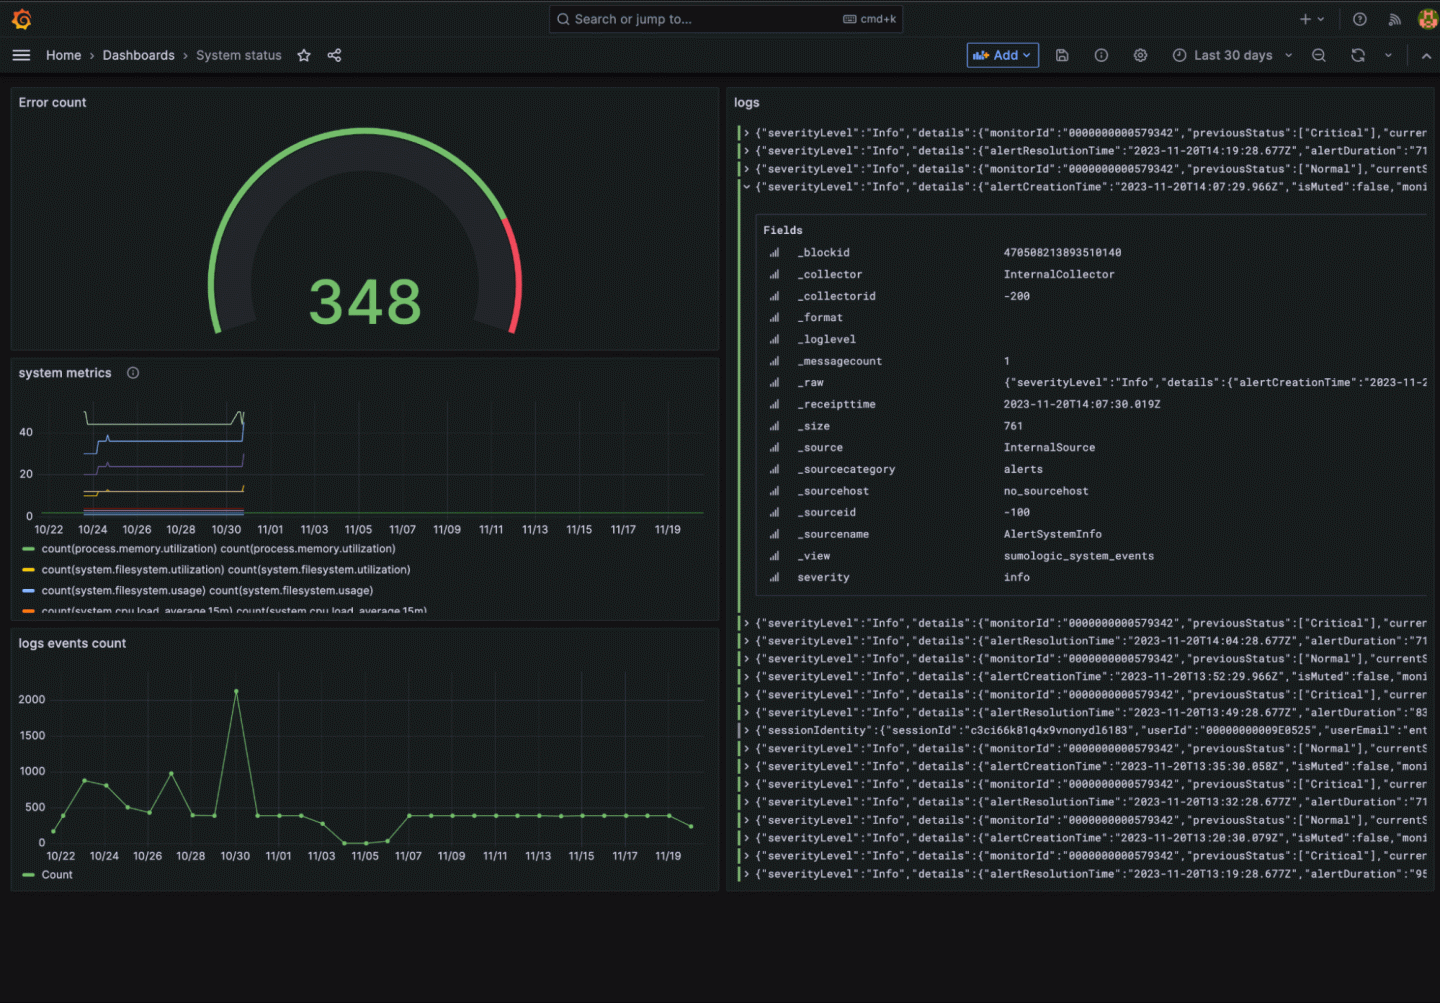
You can now easily connect Sumo Logic to your Grafana instance and visualize your Sumo Logic logs and metrics.
Read more
The OpenTelemetry project hit a number of milestones last year — and that momentum will continue throughout 2024.
Read more