Grafana OnCall: Use the new bi-directional ServiceNow integration for seamless alert flows
With this new feature, available now in Grafana Cloud, alerts flow from Grafana OnCall into ServiceNow and vice-versa, helping to keep incident...
Read more
end-to-end solutions
Opinionated solutions that help you get there easier and faster
monitor infrastructure
Out-of-the-box KPIs, dashboards, and alerts for observability
visualize any data
Instantly connect all your data sources to Grafana
Opinionated solutions that help you get there easier and faster
Instantly connect all your data sources to Grafana
Getting started with the Grafana LGTM Stack
We’ll demo how to get started using the LGTM Stack: Loki for logs, Grafana for visualization, Tempo for traces, and Mimir for metrics.
With this new feature, available now in Grafana Cloud, alerts flow from Grafana OnCall into ServiceNow and vice-versa, helping to keep incident...
Read more
Christopher Field is one of the winners of the 2024 Golden Grot Awards. Find out why his win is a testament to all the non-traditional use cases for...
Read more
Learn how to collect and analyze telemetry data from Google Cloud Run using OpenTelemetry and Application Observability in Grafana Cloud.
Read more
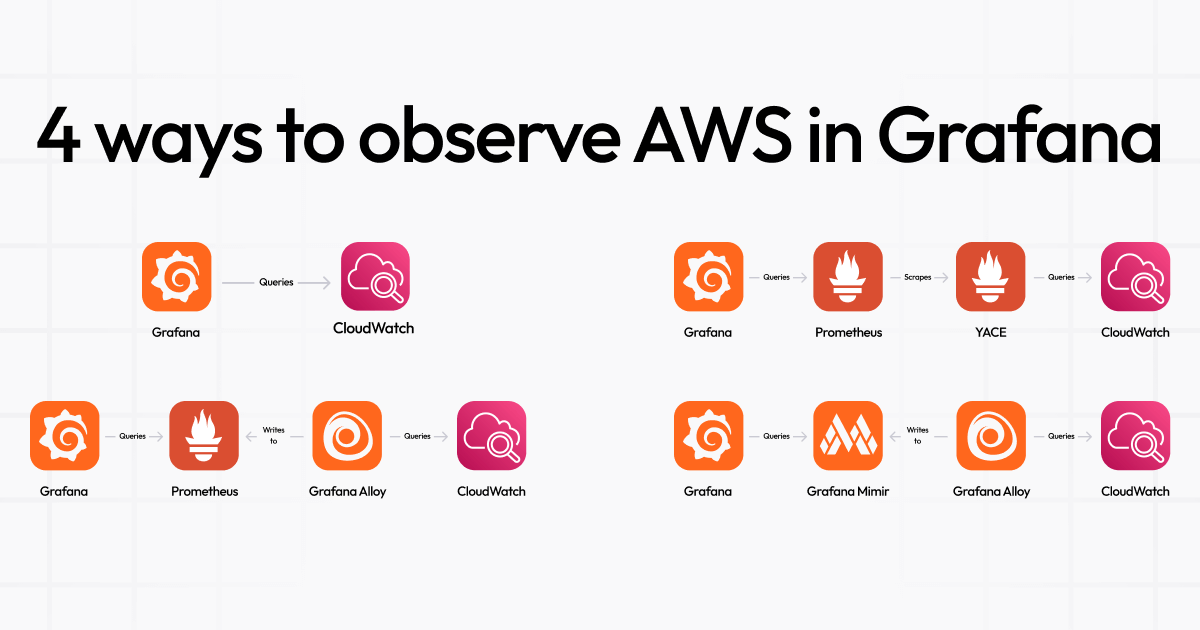
There are four ways to monitor AWS metrics in Grafana. Find out which one best fits your needs with this handy guide.
Read more
Learn how to use Grafana Beyla in Grafana Alloy to get RED metrics from your running services, as well as instrument your apps automatically in...
Read more
Learn how to set up alert group notifications in Grafana OnCall for two popular third-party ChatOps tools, Mattermost and Discord.
Read more
Catch up on all the latest and greatest features released this month in our fully managed Grafana Cloud observability platform.
Read more
Flame graph AI in Grafana Cloud uses a large-language model to assist with flame graph data interpretation so you can identify bottlenecks, root...
Read more
ObservabilityCON, our flagship open source observability event, is coming to New York City this September.
Read more
Learn how to build custom visualizations in Grafana with the all the latest Canvas panel features
Read more
Improve your incident response with the latest updates to Grafana Alerting, including simplified routing, performance improvements, consolidated...
Read more
Find out how Grafana 11 makes it easier to browse, filter, and choose which transformations will be the most helpful for the outcomes you need and the...
Read more
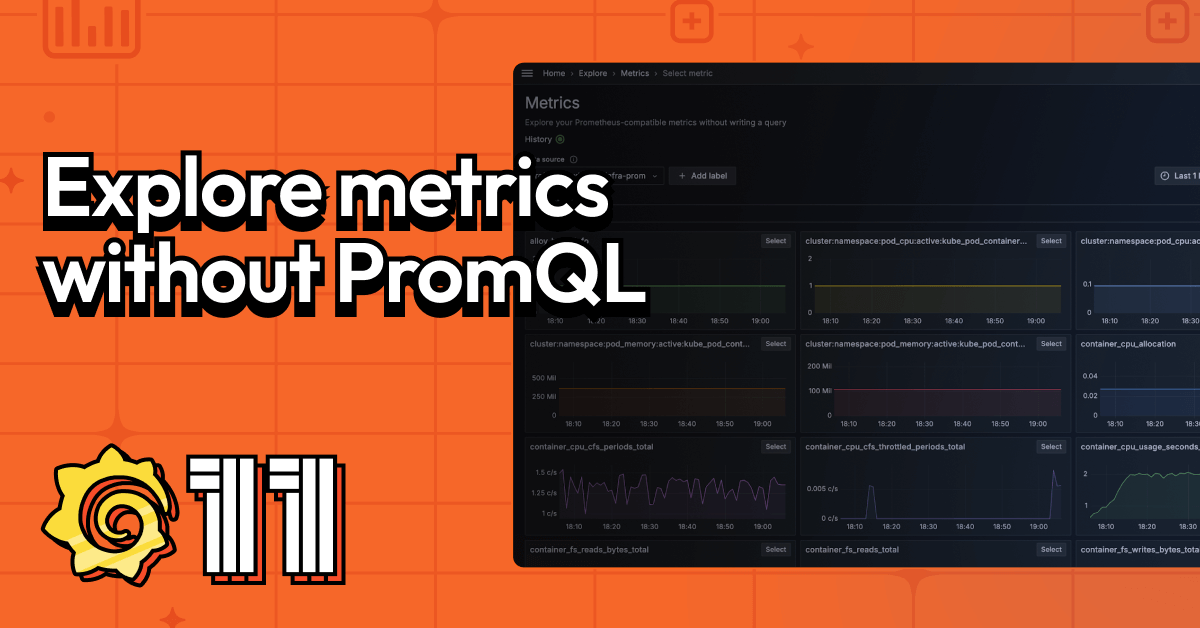
Grafana 11 introduces a queryless experience that allows you to browse metrics, identify anomalies, and uncover insights with just a few clicks — and...
Read more
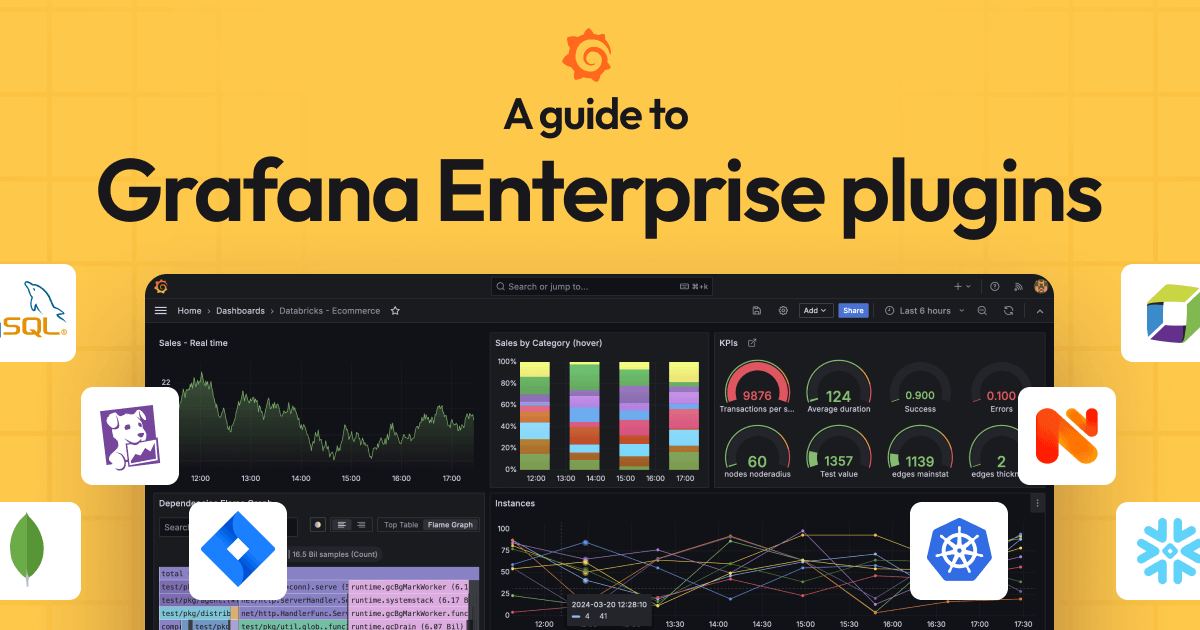
With Grafana Enterprise data sources, you can visualize data from a wide range of external systems using the Grafana dashboards you already know and...
Read more
Learn how to reduce complexity and configuration headaches when collecting Microsoft Azure metrics with Grafana Alloy.
Read more