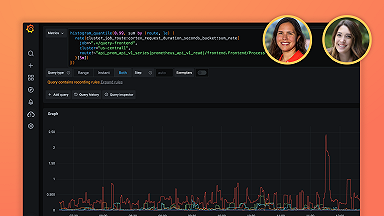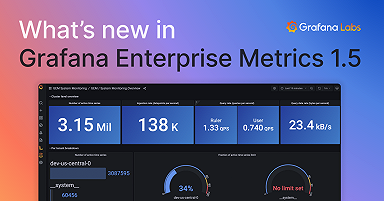
What’s new in Grafana Enterprise Metrics 1.5: Per-tenant usage metrics and a wildcard tenant for...
Read more
I am Grot. Ask me anything
Write a short description about your experience with Grot, our AI Beta.
Rate your experience (required)
Read more
Read more
Read more
Read more
Read more
Read more
Grafana Virtual Meetup Recap: IoT monitoring setup, SLO tips, and a guide to Grafana's wide time series format.
Read more
Read more
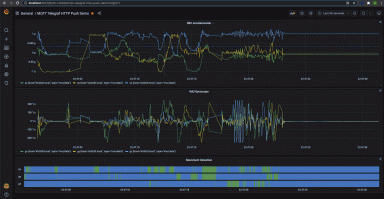
How to stream real-time metrics from Telegraf to Grafana over HTTP Post using Grafana Live.
Read more
Read more
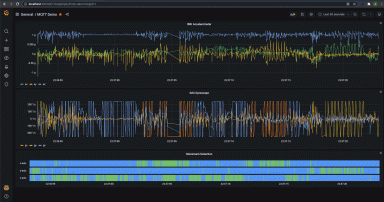
This simple demo showcases how powerful the new streaming API is when it comes to visualizing real-time data with a datasource plugin using Grafana...
Read more
This guest blog shares best practices for implementing logs and traces on serverless infrastructure.
Read more
Read more
Read more
Read more
