Creating alerts from panels in Kubernetes Monitoring: an overlooked, powerhouse feature
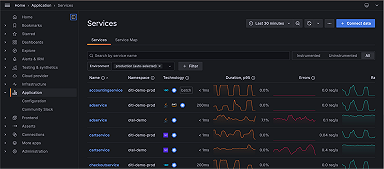
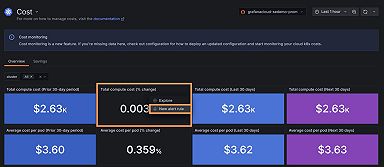
You can now set up alerts directly from certain types of panels within the Kubernetes Monitoring app, making incident management smoother than ever.
Read more
You can now set up alerts directly from certain types of panels within the Kubernetes Monitoring app, making incident management smoother than ever.
Read more
We are excited to announce the opening of a new Grafana Cloud region in Indonesia.
Read more
The latest episode of "Grafana's Big Tent" is about how eBPF can observe and affect what happens across a system and its applications.
Read more
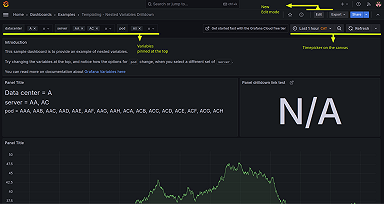
Grafana's frontend has undergone a major upgrade under the hood. See why we migrated our dashboard architecture to utilize the Grafana Scenes library...
Read more
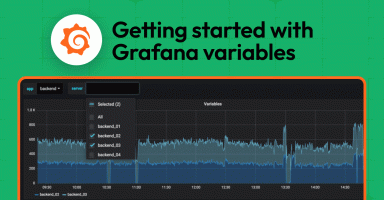
Variables in Grafana allow you to filter and search for the data you care about most, without having to edit queries or rebuild dashboards.
Read more
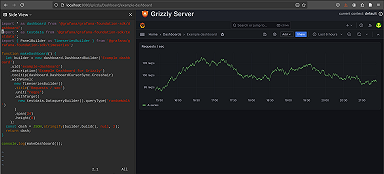
Simplify the management of Grafana dashboards in Git by managing them as code, outside of Grafana.
Read more
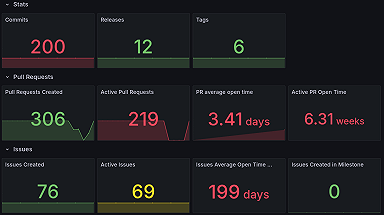
Learn how to use the GitHub data source plugin to visualize data related to your team’s daily use of the popular version control and collaboration...
Read more
Learn about exciting new features and get expert insights from observability leaders at Grafana Labs, BlackRock, NVIDIA, and more!
Read more
Browser tests in Grafana Cloud k6 help you interact with real web browsers and simulate user actions to ensure the best possible end-user experience.
Read more
Grafana 11.3 marks the general availability of Scenes-powered dashboards plus introduces more features and functionality to improve your dashboarding...
Read more
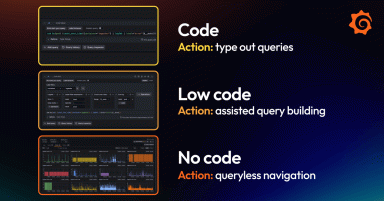
From complex queries to queryless explorations, everyone—from beginners to experts—can get value out of their telemetry data and realize the full...
Read more
The AI Observability solution helps you observe every nuance of your AI models, from performance bottlenecks to anomaly detection—all within the...
Read more
Hear why Kubernetes monitoring is essential for understanding your applications and managing costs.
Read more
Today we rolled out patch releases for Grafana 11.0.x, 11.1.x, and 11.2.x that include a critical severity security fix. If you are affected, we...
Read more
Follow this step-by-step tutorial to learn how to configure the OpenTelemetry Operator with your Kubernetes cluster in just 20 minutes.
Read more


