5 tips to write better browser tests for performance testing and synthetic monitoring
Here are five best practices to write browser test scripts and integrate them into your workflow using Grafana k6, Grafana Cloud k6, or Grafana Cloud...
Read more
Here are five best practices to write browser test scripts and integrate them into your workflow using Grafana k6, Grafana Cloud k6, or Grafana Cloud...
Read more
The Grafana Loki 3.3 release is here, and it brings a fresh wave of enhancements aimed at making your log management experience faster, more...
Read more
Headed to re:Invent? Visit us at booth #2053 to chat with our observability experts, watch live demos, and grab some swag.
Read more
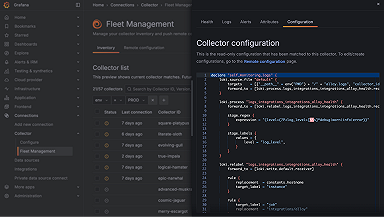
Fleet Management in Grafana Cloud is designed for teams looking to manage hundreds or thousands of collectors efficiently, so they can remotely...
Read more
Quest World is a new interactive game — created using OTel, Grafana Alloy, and the Grafana LGTM Stack — designed to help you learn the basics of...
Read more
Being part of prometheus-community will give the Amazon CloudWatch exporter increased visibility and help ensure its long-term sustainability.
Read more
In the latest episode of "Grafana's Big Tent" podcast, Grafana Labs team members recap the highlights of the Grafana 11 release, and offer an early...
Read more
It’s been one year since the release of Grafana Beyla 1.0. Here’s a look at what we’ve accomplished so far, and what's next for the open source...
Read more
Here’s a closer look at some of the latest capabilities we’ve rolled out in Grafana Cloud, including new data visualization features and RBAC for...
Read more
Today we are releasing Grafana 11.3.0+security-01 and 11.2.3+security-01, which include a medium severity security fix. If you are affected, we...
Read more
Learn about some important Grafana release updates on end-of-year release freezes, security versioning, and the new docs page for all things...
Read more
Learn how to use the MQTT data source plugin for Grafana and CSS Electronics' Python API to set up custom CAN-USB streaming dashboards in less than...
Read more
In this post, you'll learn how to create Grafana dashboards featuring data from disparate sources, how to incorporate multiple queries from a single...
Read more
It's getting easier than ever to store and query OpenTelemetry data inside Prometheus. Follow this guide to see how to better integrate these projects...
Read more
Meet us at KubeCon North America 2024! Our observability experts are participating in multiple sessions throughout the week, and you can find us at...
Read more
