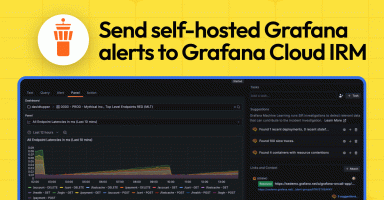
How to send alerts from Grafana OSS to Grafana Cloud IRM
Connect your alerts from self-hosted Grafana OSS or Grafana Enterprise instances to Grafana Cloud IRM to escalate and manage incidents.
Read more
Connect your alerts from self-hosted Grafana OSS or Grafana Enterprise instances to Grafana Cloud IRM to escalate and manage incidents.
Read more
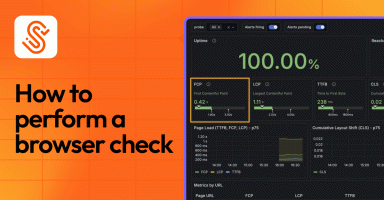
Learn how to perform a browser check in Grafana Cloud Synthetic Monitoring to simulate user interactions with your website and ensure the best...
Read more
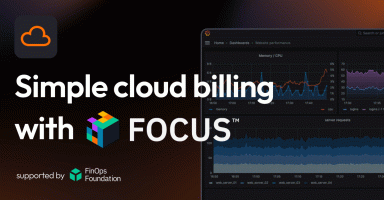
We’re excited to share that Grafana Cloud offers the FinOps Open Cost and Usage Specification (FOCUS), a community-driven, open standard for cloud...
Read more
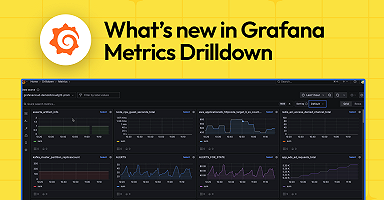
Recent updates to Grafana Metrics Drilldown, including new filtering and sorting options, make it even easier and faster to find key metrics with just...
Read more
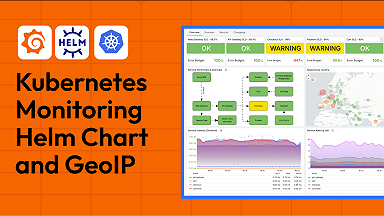
Adding geographical context to logs can help you troubleshoot faster, optimize performance, and more. Here’s how to do just that with the Kubernetes...
Read more
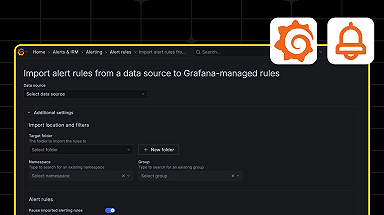
New in Grafana 12: Import your existing Prometheus, Grafana Loki, or Grafana Mimir rule files into Grafana-managed alerts and recording rules in bulk,...
Read more
Today we are releasing Grafana 12.0.1, 11.6.2, 11.5.5, 11.4.5, 11.3.7, 11.2.10, and 10.4.19, which include medium and high severity security fixes. If...
Read more
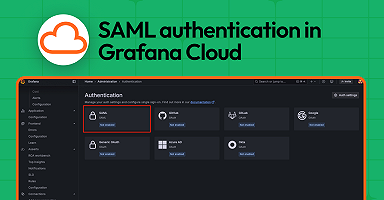
SAML authentication in Grafana Cloud: a guide for easy configuration
Read more
On the heels of GrafanaCON 2025 and the release of Grafana 12, there are a ton of Grafana Cloud updates to share this month.
Read more
Today we are releasing Grafana 12.0.0+security-01, as well as security patches for all supported versions for a high severity security fix. If you are...
Read more
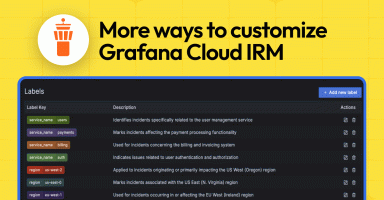
Configure Grafana Cloud IRM to better suit your specific needs by using new features to customize your incident labels, metadata fields, and incident...
Read more
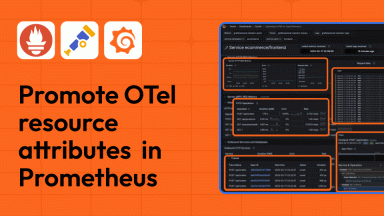
Learn how resource attribute promotion improves the integration between OpenTelemetry and Prometheus, and how it simplifies dashboard creation and...
Read more
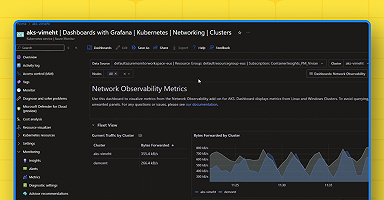
Microsoft Azure partnered with Grafana Labs to offer Grafana dashboards directly in the Azure Portal and provide immediate access to prebuilt...
Read more
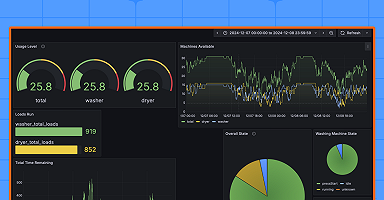
Using TimescaleDB and Grafana, Dakota and Cole — two students, friends, and data enthusiasts — built an observability solution to make laundry days in...
Read more
Our investigation wrapped up on May 12, and we have confirmed that there has been no code modification, unauthorized access to production systems,...
Read more
