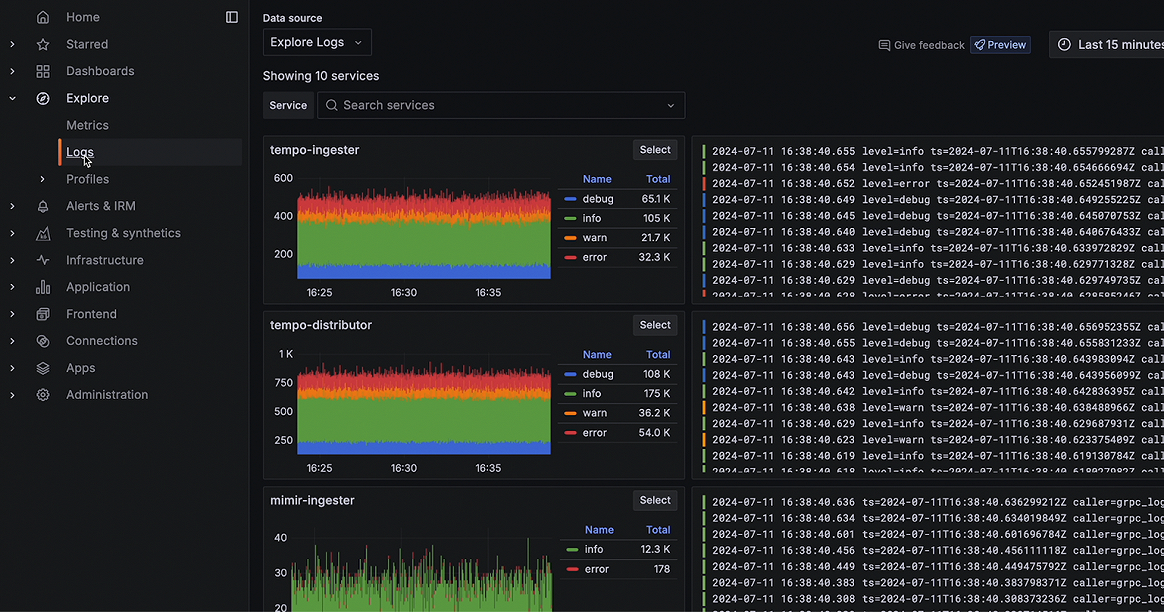
Get insights from logs without writing a query: Explore Logs is in Public Preview
See how we're improving Explore Logs, an interface for quickly extracting insights from logs without needing to run a query, so you can identify...
Read more
Open Source
Community resources
Dashboard templates
Try out and share prebuilt visualizations
Prometheus exporters
Get your metrics into Prometheus quickly
end-to-end solutions
Opinionated solutions that help you get there easier and faster
monitor infrastructure
Out-of-the-box KPIs, dashboards, and alerts for observability
visualize any data
Instantly connect all your data sources to Grafana
Docs
Get started
Get started with Grafana
Build your first dashboard
Get started with Grafana Cloud
What's new / Release notes
Opinionated solutions that help you get there easier and faster
Instantly connect all your data sources to Grafana
Getting started with the Grafana LGTM Stack
We’ll demo how to get started using the LGTM Stack: Loki for logs, Grafana for visualization, Tempo for traces, and Mimir for metrics.
I am Grot. Ask me anything
Write a short description about your experience with Grot, our AI Beta.
Rate your experience (required)
News, releases, technical articles, cool stories, and more.
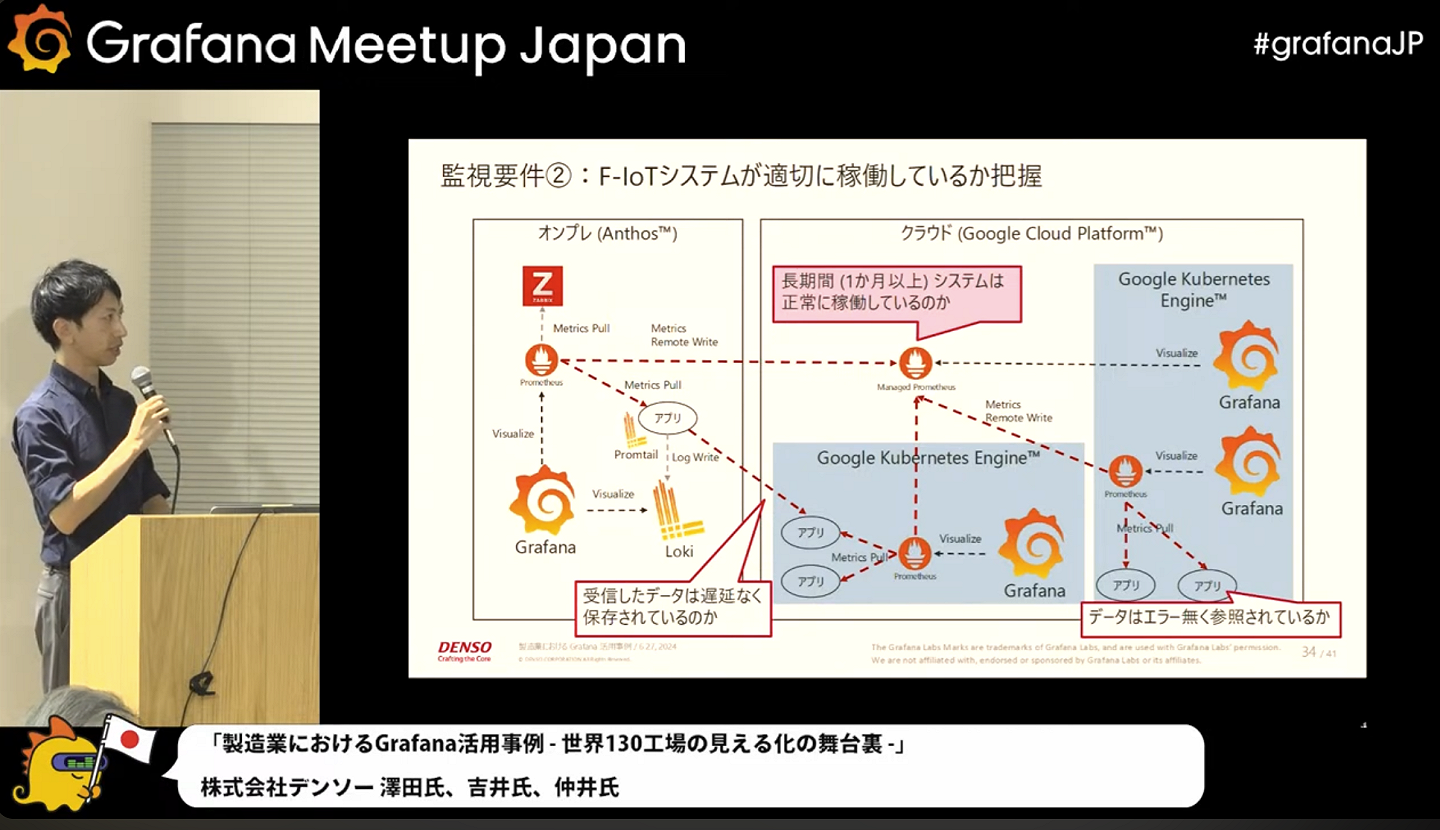
The OSS community in Japan is also an integral part of the larger Grafana community, helping to organize meetups, develop new data sources, and even...
Read more
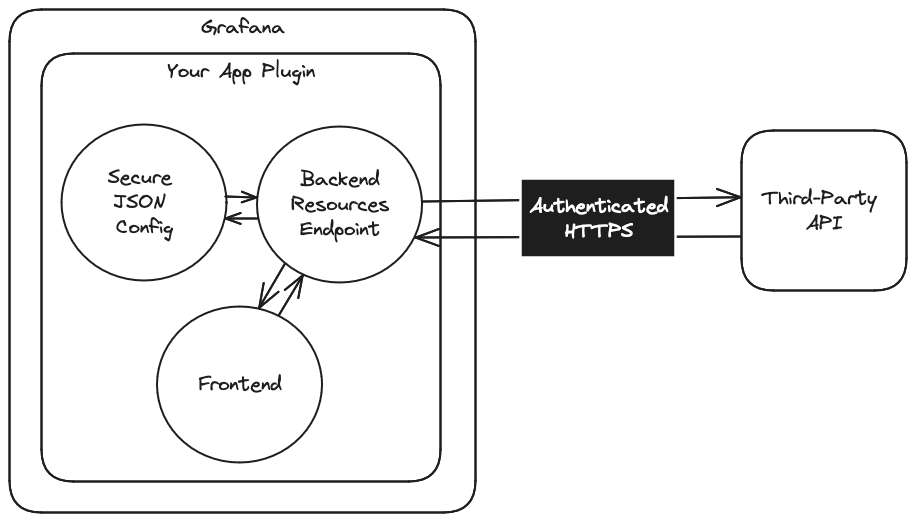
Learn how to securely authenticate against third-party APIs within your Grafana app plugin to ensure that your integrations are not only powerful,...
Read more
Grafana Labs is partnering with Intigriti, a leading bug bounty platform, to expand our bug bounty program in a scalable, sustainable way.
Read more
Learn how to use the Grafana Ansible collection to deploy and manage Mimir across multiple Linux host so you can explore your data in Grafana.
Read more
Grafana 11.1 delivers a sought-after visualization feature (hint: text in table panels will be easier to read!), Grafana Alerting improvements, and...
Read more
The latest release of Grafana Tempo introduces a new Parquet storage format, gRPC streaming formats on the frontend, and additional TraceQL metrics...
Read more
Learn about all the latest features in the Grafana 11 release.
Read more
Learn about all the latest features in Grafana Loki 3.0.
Read more
Ask Grot, your blog librarian
Need help finding content to answer your questions? Try our AI chat bot, Grot (beta).
See how we're improving Explore Logs, an interface for quickly extracting insights from logs without needing to run a query, so you can identify...
Read more
Join us on this journey to uncover the secrets of bird song and the power of observability, using open source tools like BirdNET, Prometheus, Grafana...
Read more
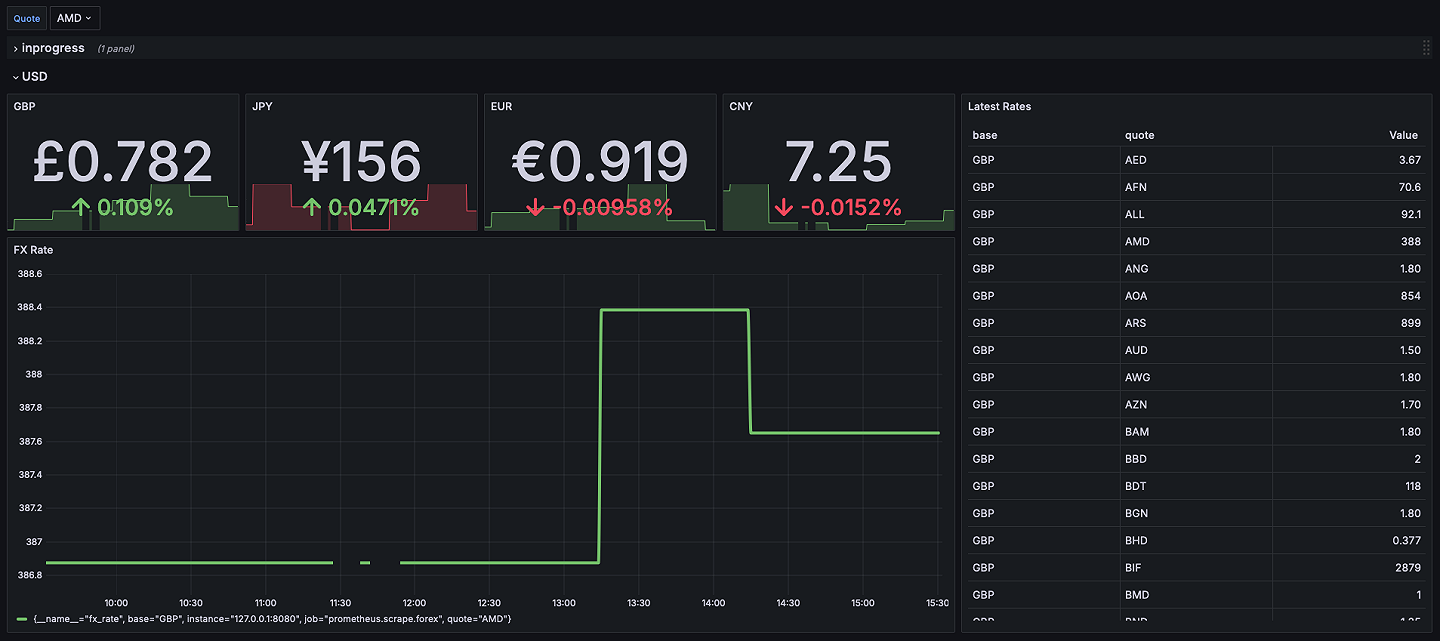
Discover how to use Grafana to track changes in foreign exchange rates so your money goes further when you travel.
Read more
Learn how Mux is using Grafana Cloud for metrics, logs, and traces — and how they plan to extend their stack with Grafana Cloud K6, Grafana IRM,...
Read more
Learn how to use Prometheus and Grafana Cloud to build a free and flexible database monitoring solution.
Read more
Explore why monitoring LLM applications is so important and how you can do it more easily by using OpenTelemetry, Grafana Cloud, and OpenLIT.
Read more
The OSS community in Japan is also an integral part of the larger Grafana community, helping to organize meetups, develop new data sources, and even...
Read more
Learn how to securely authenticate against third-party APIs within your Grafana app plugin to ensure that your integrations are not only powerful,...
Read more
Grafana Labs is partnering with Intigriti, a leading bug bounty platform, to expand our bug bounty program in a scalable, sustainable way.
Read more
Learn how to use the Grafana Ansible collection to deploy and manage Mimir across multiple Linux host so you can explore your data in Grafana.
Read more
Learn how Mux is using Grafana Cloud for metrics, logs, and traces — and how they plan to extend their stack with Grafana Cloud K6, Grafana IRM,...
Read more
Learn how to use Prometheus and Grafana Cloud to build a free and flexible database monitoring solution.
Read more
Explore why monitoring LLM applications is so important and how you can do it more easily by using OpenTelemetry, Grafana Cloud, and OpenLIT.
Read more
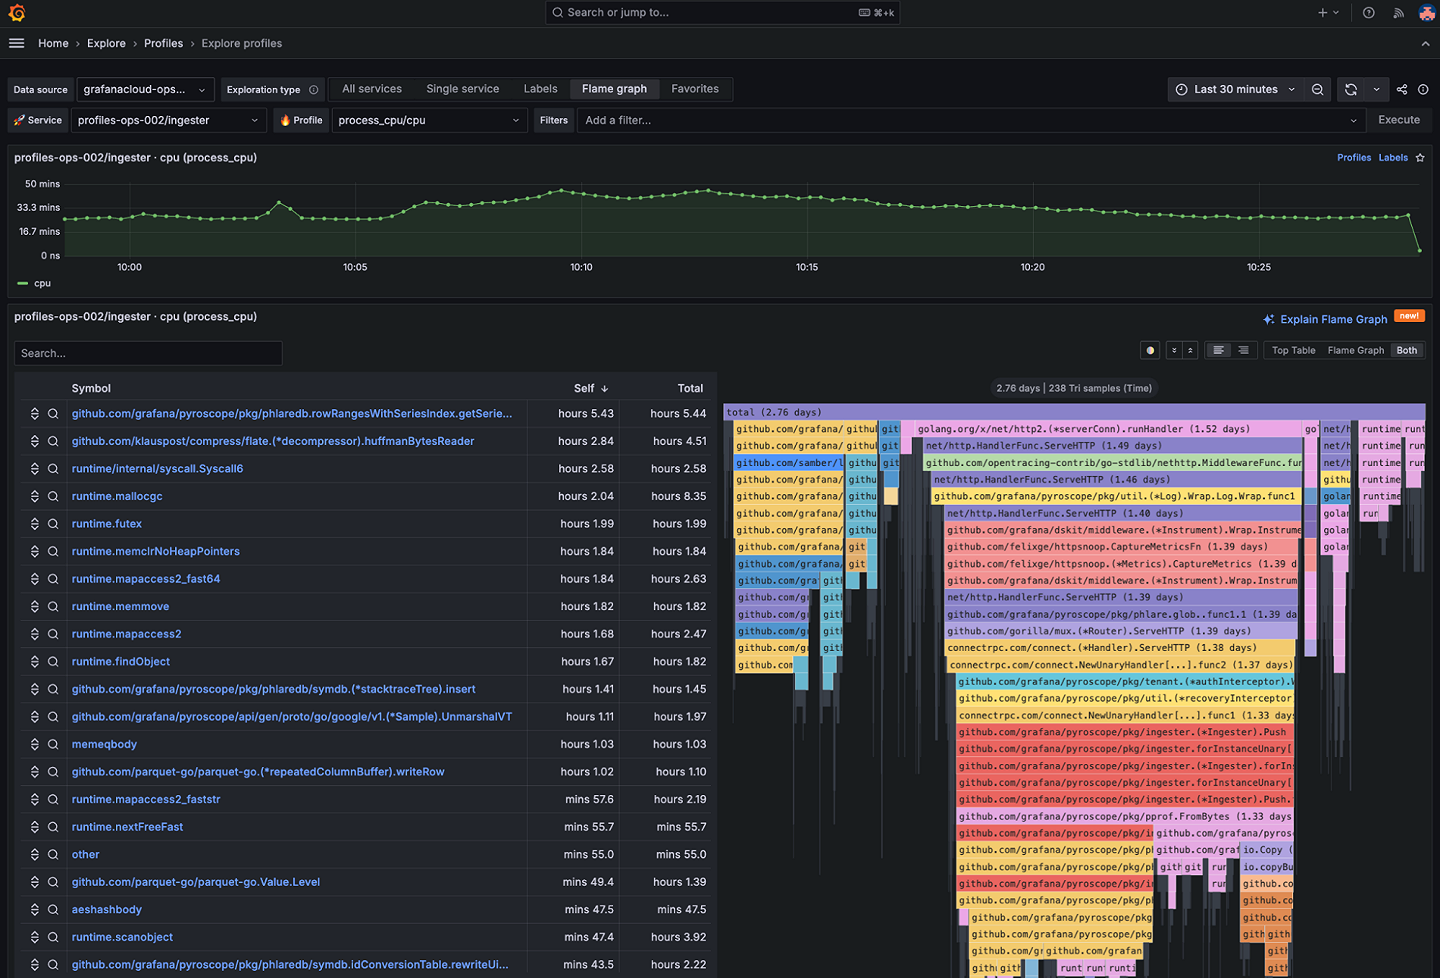
The Explore Profiles app provides a smooth, queryless experience to browse and analyze your profiling data. Here’s how to get started today.
Read more
See how we're improving Explore Logs, an interface for quickly extracting insights from logs without needing to run a query, so you can identify...
Read more
From new troubleshooting tools in Kubernetes Monitoring to browser tests in Grafana Cloud k6, here’s a look at some of the latest and greatest...
Read more
Learn how to integrate performance testing into your development process with GitHub Actions and Grafana k6.
Read more
Join us on this journey to uncover the secrets of bird song and the power of observability, using open source tools like BirdNET, Prometheus, Grafana...
Read more
Discover how to use Grafana to track changes in foreign exchange rates so your money goes further when you travel.
Read more
Check out the agenda for ObservabilityCON 2024, a two-day conference kicking off in New York City on Sept. 24. Participate in hands-on sessions and...
Read more
Map out your Grafana upgrades to fit your needs. Find out what to expect from the Grafana OSS and Grafana Enterprise releases, and when to expect...
Read more