Creating alerts from panels in Kubernetes Monitoring: an overlooked, powerhouse feature
As a product manager here at Grafana Labs, I’ve learned that sometimes the most powerful features can sneak by unnoticed, buried in those three little dots off to the side of the panel. But what happens when one of those hidden gems suddenly becomes the star of the show?
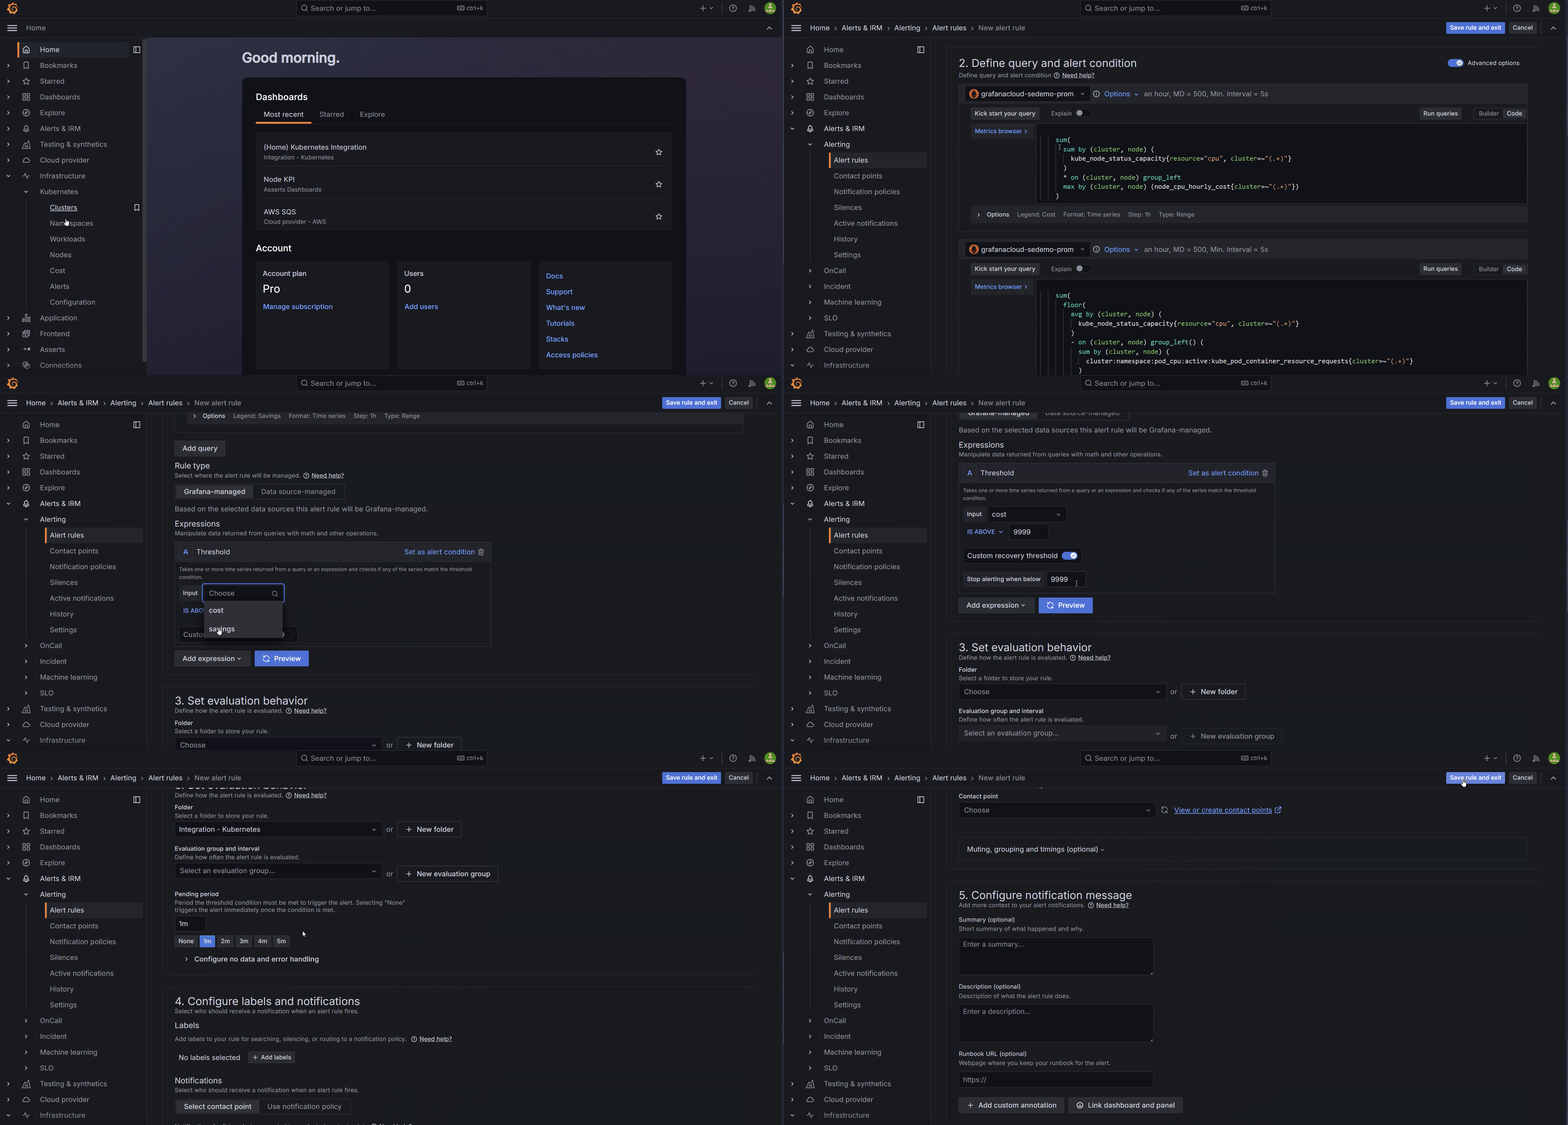
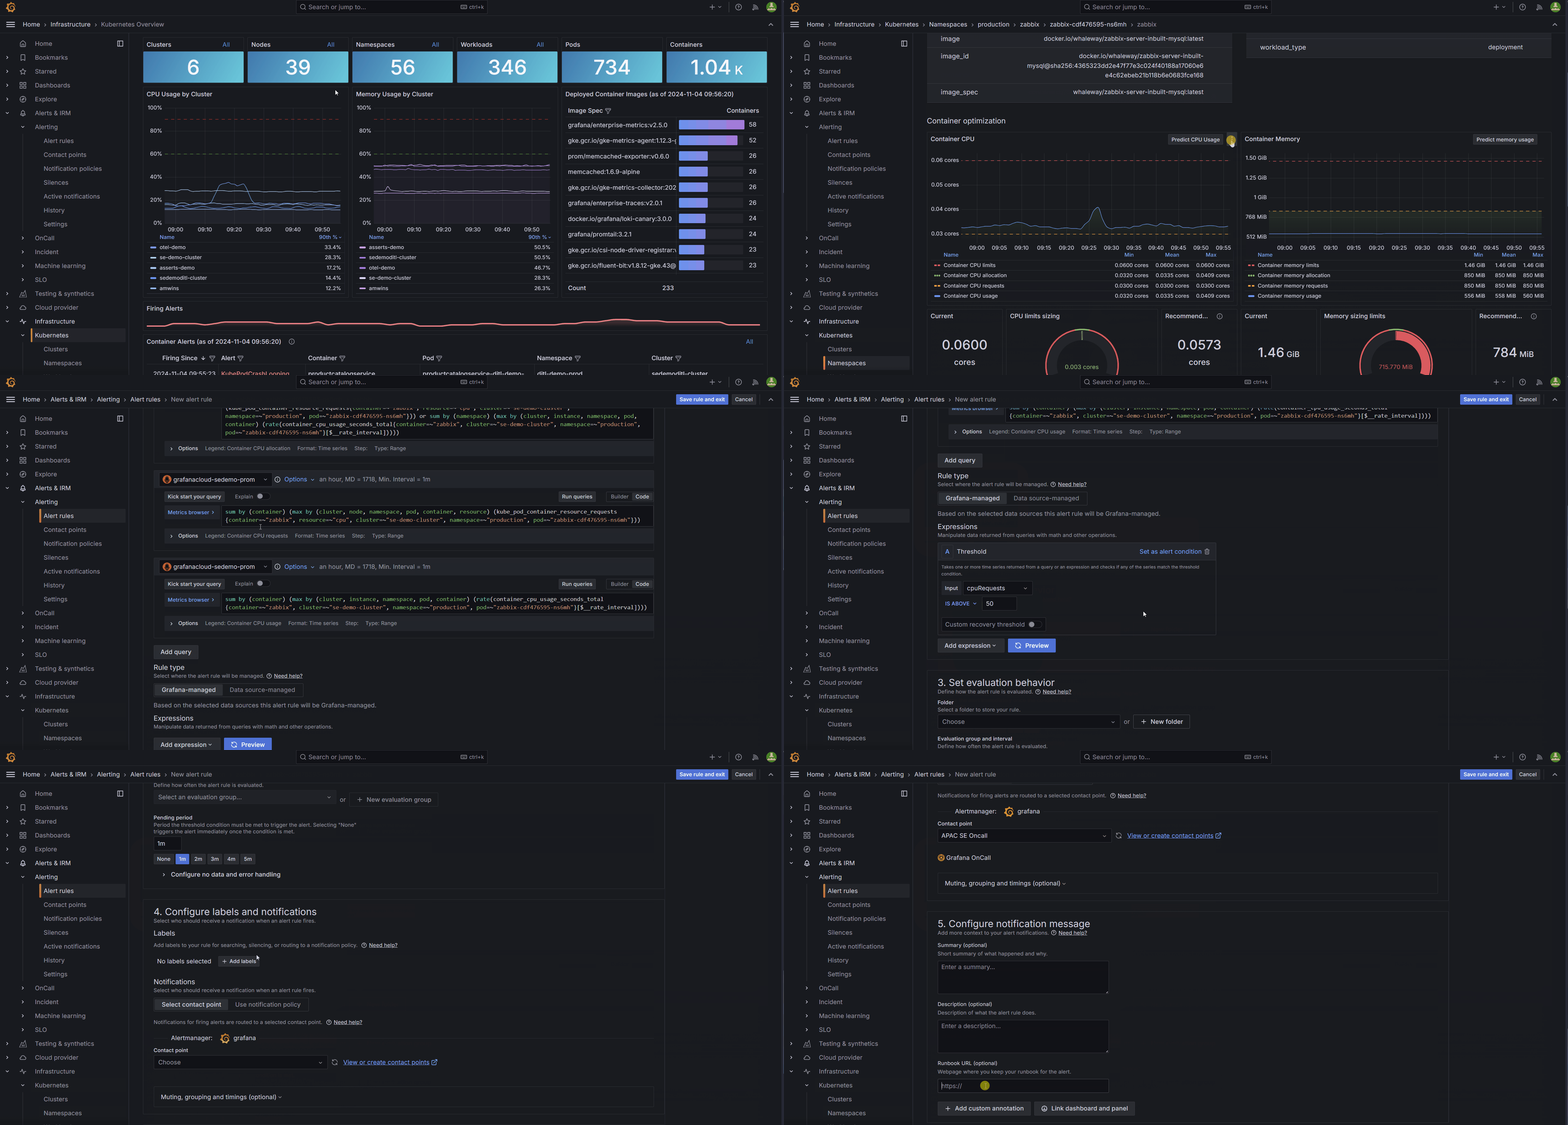
Recently, we released a new Kubernetes Monitoring feature in Grafana Cloud—an alert system you can use to create alerts from panels in the app. It pulls the query behind the panel, gives you the option to set a threshold, and notifies you when that threshold is exceeded.
Simple, right? I thought so too. In fact, while I was pleased to see it, I didn’t give it a second thought. After all, it was just one of many features—including viewing deleted objects, monitoring energy consumption, and network observability—nestled within our Scenes capability. I didn’t immediately grasp its significance. That is, until I was smack in the middle of a live demo for one of our biggest customers.
Small feature, big potential
Before I get into the nerve racking demo and all the good that came from it—for them and me—let’s quickly review how you can benefit from this alerting system.
You can now set up alerts directly from certain types of panels within the Kubernetes Monitoring app, making incident management smoother than ever. With our preconfigured panels that highlight the essentials—like CPU limits, network saturation, container resource recommendations, power consumption, and cost-saving thresholds—you can easily monitor and manage your Kubernetes infrastructure.
Steps to set up an alert
- Choose a panel: Select a panel that fits your needs, whether it’s for tracking resource usage, network health, or cost management.
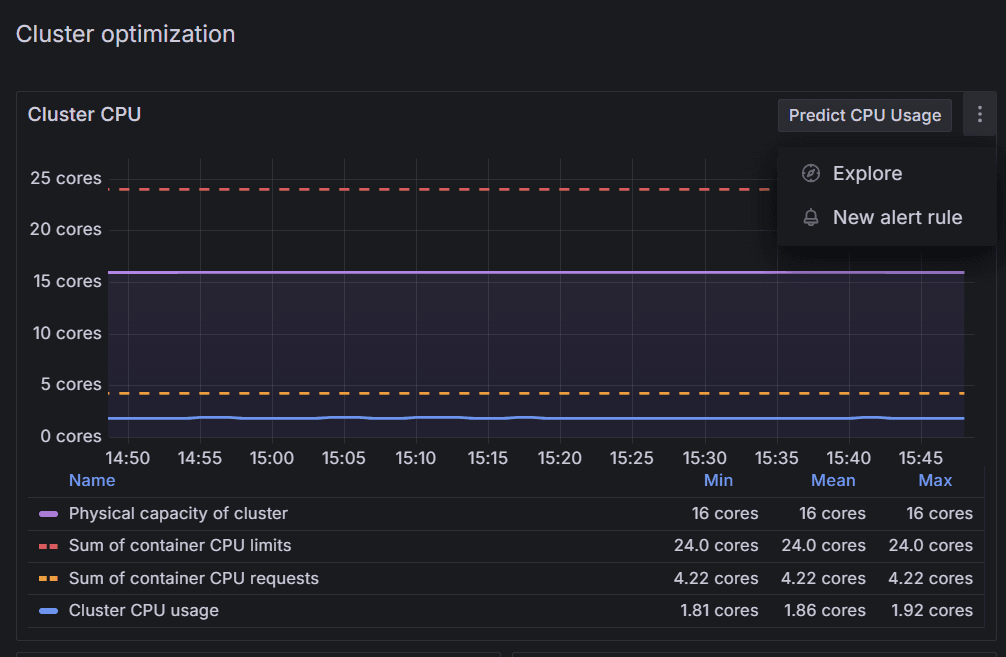
- Create an alert rule: Click the top-right corner of the panel and select New alert rule.
- Customize your alert: A pre-filled template will appear with a relevant query. From there, just specify:
- The threshold (e.g., CPU usage percentage)
- Runbook and recipient(s)
That’s it! Your alert system is ready to notify the right people whenever thresholds are met.
Why use alerts?
These alerts can help you proactively manage resources. For example, they can:
- Notify your finance team when costs approach the quarterly budget.
- Trigger an alert for your DevOps team on network saturation or idle cluster costs.
Starting small with a few essential alerts can give you immediate insights. From there, expand your alerting to meet your company’s best practices and optimize Kubernetes operations fully.
The unexpected spotlight
OK, back to the demo. I was presenting to one of our top customers—a company that was very focused on controlling costs. They wanted insights and alerts from their cloud provider all the way down to the container level. You can imagine the cast of characters: the CFO, financial analysts, cloud admins, DevOps engineers—basically, everyone who needs to know when something goes sideways.
So, there I was, rolling through the slides, feeling pretty good. And then I got to the live demo. Now, if you’ve ever done a live demo, you know how it goes—everything can go perfectly… or it can go horribly wrong.
So I took a deep breath and dove in.
I pulled up the cost monitoring view, showing monthly variations, and casually demonstrated how we could create an alert right there from the panel. A couple of clicks, set a threshold, and—boom!—the system would notify them if the monthly cost suddenly spiked.

The light bulb moment
Suddenly, the whole room was buzzing. We started setting up more alerts—one for next month’s projection, another for underutilized nodes to save on cloud spend, and yet another for containers that were under-provisioned.

By this point, the excitement was palpable. They could now have automated budget guardrails and the potential to save money by proactively controlling their spending.
They also shared how some of their newer developers were spinning up CPU-intensive containers without limits—costly mistakes that were flying under the radar. So, we set an alert that would scream if any container had limits that were too high or, worse, not set at all.

The aftermath
The call ended with everyone on the edge of their seats, ready to implement these alerts across their infrastructure. I sat back in my chair, replaying the entire experience in my mind. And that’s when it hit me—what if I hadn’t made that call? What if I hadn’t shown them this feature?
This incredibly useful tool, tucked away in the corner of a panel, could have easily been missed. And if they hadn’t seen it in action, it might have never been used to its full potential.

The takeaways (and what you can learn too)
So, what did I learn from this experience? Here are my top three takeaways:
- Set your Kubernetes limits and/or requests. Seriously, this is the golden rule for saving money and avoiding operational headaches. It’s a small step that can prevent massive overspending and under-performance. (For more on this approach, check out this post we wrote for the Kubernetes blog.)
- Alerts are key. Even if you have the fanciest visualizations or custom scrape configs, without alerts, you might miss the boat when it comes to proactive cost saving.
- Experiment with new features! Sometimes the tools you think are “just another release” can end up being your team’s next big thing. Give yourself time to explore and unlock their full potential.

So next time you’re deep in the weeds of a product release, remember: even the smallest, most “buried” features can turn out to be the unsung heroes of your platform. And you? You just might be the one to uncover them.
Grafana Cloudis the easiest way to get started with metrics, logs, traces, dashboards, and more. We have a generous forever-free tier and plans for every use case. Sign up for free now!


