
Grafana for beginners: Quick tips to add a data source, choose a visualization type, and more
In the observability space, ease-of-use has always been a key differentiator for Grafana. As much as we want to offer a powerful observability platform to our users, we also want to ensure they can get up and running as quickly as possible.
Still, for those of you sitting down to build your first dashboard, we totally understand that a little guidance can go a long way.
In this post — which was inspired by our “Grafana for Beginners” YouTube series — we offer quick tips and step-by-step advice to help you and your team ramp up with Grafana.
How to add a data source
One of the most powerful features of Grafana is the ability to query and visualize data from such a wide variety of sources. So, before you start building your first dashboard, you’ll need to add a data source that contains the data you want to visualize.
Add a data source
Grafana comes with support for many built-in support data sources.
To add a data source in Grafana, use the following steps:
- Click Connections in the left-side menu.
- Enter the name of a specific data source in the search dialog. You can filter by Data source to only see data sources.
- Click the data source you want to add.
- Configure the data source following instructions specific to that data source.

Note: If you need other data sources that are not already built into Grafana, you can install one of our many data source plugins. If the plugin you need doesn’t exist yet, developing a custom plugin is also an option.
Add Grafana Loki as a data source
To further illustrate how to add a data source in Grafana, let’s walk through an example using Grafana Loki, our open source, horizontally scalable, log aggregation system, as a built-in data source. (By the way, the steps outlined here can also be used to add Grafana Tempo and Grafana Mimir as data sources, as the process is nearly identical).
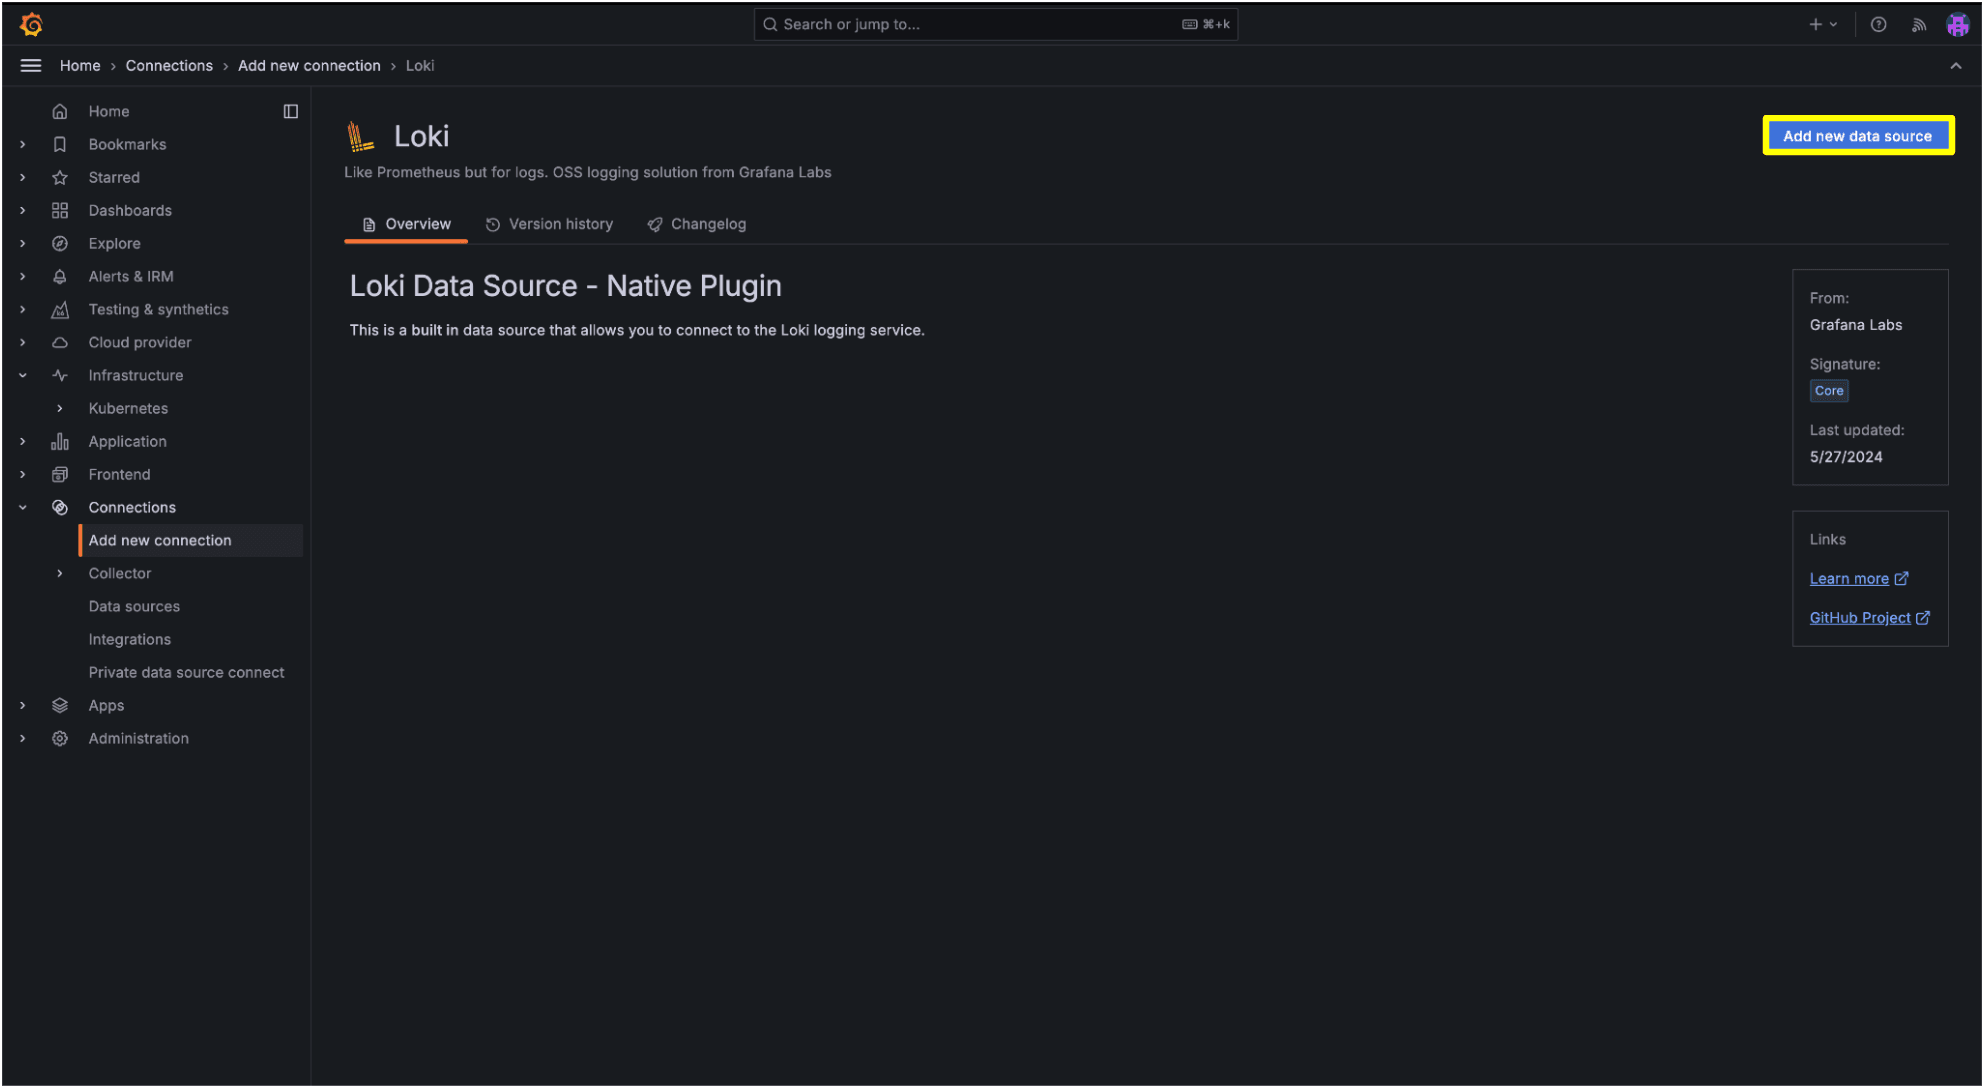
First, search for Loki in the search bar. You’ll see the results populate. Then, go to the Data source section and click on the Loki data source option.

Next, click on Add new data source.
Provide a name for this data source and make sure it’s descriptive, so you can easily tell what kind of data it contains. Next, enter the URL for the data source to indicate to Grafana how to find it.

If your Loki data source requires authentication, you’ll need to include that info, as well. Scroll down to the Authentication section. Then, expand the drop-down menu and select the Basic authentication option.

Enter the username and password. Then, scroll down to the bottom of the page and click on Save and test. Once the data source is successfully connected, it’ll give you an option to visualize or query the data — and you’re off and running!
To learn more about adding data sources to Grafana, you can check out the video below, as well as our technical documentation.

How to choose a visualization type
When it comes to data visualization, there’s no one-size-fits-all approach. Ultimately, the best way to visualize your data depends on your unique use case, and the story you’re hoping to tell through your data. Fortunately, Grafana offers a wide variety of visualization types to choose from when creating your dashboard.
To help you select the right one, it’s helpful to first have a lay of the land. Here’s a quick look at a few of the most popular data visualization options in Grafana, and the typical use cases they support.
Time series
Time series graphs are the default way to visualize data points over intervals of time. So, for example, if you’ve ever looked at a graph that shows the rise and fall of the temperature throughout the day, or if you’re a YouTuber tracking your number of subscribers over time, you’re looking at time series visualization. These visualizations can render series as lines, points, or bars, and are versatile enough to display almost any type of time series data.

Stat panel
A stat panel displays your data in single values of interest — such as the latest or current value of a series — with an optional graph sparkline. A graph sparkline, which is only available in stat visualizations, is a small time-series graph shown in the background of each value in the visualization. You would use this if you want real-time stats about a value that you’re interested in. For example, if you’re monitoring the utilization of various services, you can use a stat visualization to show their latest usage.

Stat panels are a great way to monitor key metrics, such as the number of high-priority bugs in your application or total number of sales, at a quick glance.
Bar charts
Bar charts allow you to graph categorical data. These are useful when you want to compare data by categories. For example, let’s look at a bar chart for web browser market share. On the y-axis, it displays different categories of browsers such as Chrome, Firefox, Safari, etc. On the x-axis, it shows you the value of the market share. You can clearly compare the market share of each browser by looking at the size of the bars.

These are just three (of many) visualization options in Grafana. To learn more, check out our documentation and click on each type of visualization for step-by-step instructions. You can also watch the video below.

How to create alerts
As beautiful as your dashboards are, you probably don’t have time to look at them 24/7. Instead, you can use Grafana Alerting to get alerts when something needs your attention.
Let’s say you have an e-commerce app, and you want to create an alert for any high-service latency observed in the app. If service latency is greater than 2 seconds, you want to receive an email alert. The alert will display contextual information and the option to view the dashboard associated with the event.
To start, go to your Grafana instance and expand the menu option. From the menu, locate the Alert and IRM option, then click on the arrow to display the sub menu. From there, click on the Alerting option to get to the Alerting page.

Then, there are three basic steps to create alerts:
- Define a condition that must be met for an alert to fire. To do this, you’ll create an alert rule.
- Configure where the alerts should be delivered by establishing contact points.
- Configure which alerts are sent to which contact points. This is known as defining notification policies.
Let’s take a closer look at each.
Define an alert rule
Click on the Manage alert rules option, then click on the New alert rule button.

An alert rule is a set of evaluation criteria for when an alert should fire. An alert rule consists of:
- Queries and expressions that select the data set to evaluate.
- A condition (the threshold) that the query must meet or exceed to trigger the alert instance – for example, a certain amount of service latency is observed.
- An interval that specifies the frequency of alert rule evaluation and a duration indicating how long the condition must be met to trigger the alert instance.
- Other customizable options, such as setting what should happen in the absence of data, notification messages, and more.
Establish contact points
Now, you configure where the alert should be delivered. From the menu, click on the Contact points option, then click Add contact point.

Next, click on Create contact point and name the contact point. For example, if you want the alert to go to the SRE on call, you could name your contact point to reflect that. Then, select what channel you want to use to send the alert, such as an email, webhook, or service like Grafana OnCall or Slack. You’ll be able to test that the contact point is working properly before you save it.
Configure notification policies
Notification policies provide you with a flexible way to design how your notifications are handled, and help minimize alert noise. Using label matchers, alert instances are routed to notification policies. The notification policy can then group multiple alert instances into a single notification and deliver it to the contact point.
You can configure the notification policy by clicking on Notification policies.

To dig deeper into the alerting process, check out our Grafana Alerting documentation, along with the video below.

How to annotate events
Annotations in Grafana are a way to indicate within data visualizations that certain events took place. Think of them as little Post-it notes you can add to your visualizations to provide more context and help your team determine next steps.
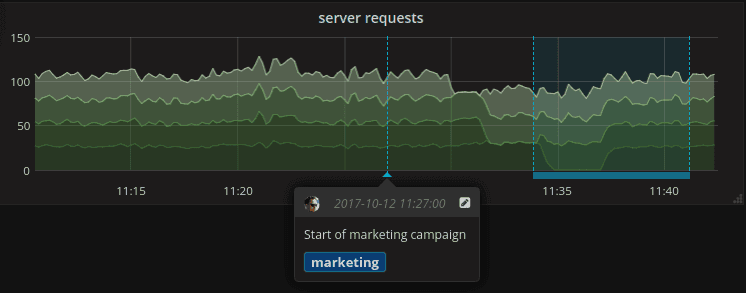
Annotations are visualized as vertical lines and icons on all graph panels. When you hover over an annotation, you can get an event description and event tags, as shown in the example below. The text field can include links to other systems with more detail.
To manually add an annotation, click wherever you want to add it within your panel. Once the popup menu appears, click on the Add annotation option.

In the Description field, you can add further details or context about the event, as well as a call to action for team members. For example, if you observe a major spike in service latency 2 minutes after deployment, you would annotate that something went wrong during deployment and ask to roll this back.
After filling out the description, click Save. You’ll see a vertical line and small arrow icon on your visualization, signifying your annotation has been added.
To learn more about using annotations in Grafana, you can check out our technical docs and the video below.

Where to learn more
Interested in more best practices to get started with Grafana? We’ve got you covered. Check out our entire Grafana for Beginners video series on YouTube, where we go into more detail on the topics covered above, plus other resources shared on our Community page.

