
Container monitoring with Grafana: Helpful resources to get started
In simple terms, containers are a standard package of software that enable applications to run consistently across different computing environments. Often, these applications are broken down into smaller collections of independent services known as microservices.
For many organizations, these microservices-based applications have replaced traditional monolithic applications because they offer increased performance, flexibility, and scale. And within these distributed environments, observability is crucial to ensure smooth operations and high performance.
In this blog post, you’ll learn more about using Grafana alongside Docker, Kubernetes, and Helm Charts, and some of the resources we offer to help you get started.
The benefits of Grafana for container monitoring
Containerized environments are distributed and somewhat complex, consisting of multiple microservices and other software components. That means collecting and visualizing metrics is essential to identify potential bottlenecks and optimize operating costs.

Grafana enables you to query, trigger alerts, and explore your metrics, logs, and traces wherever they are stored. You can visualize these metrics using customizable dashboards to easily gain insight into containers and their underlying infrastructure, making it easier to identify and troubleshoot issues, optimize performance, and make informed decisions. For example, by creating a maximum disk usage alert, you can inform your operations team in advance before an application crashes in a production environment. Similarly, you could identify if one of your database clusters is performing slowly in response to incoming queries.
Resources for getting started
The Grafana Labs Developer Advocacy team has significantly improved our documentation related to using Grafana alongside Docker, Kubernetes, and Helm Charts. This comprehensive documentation provides users with all the necessary information and guidance to successfully deploy, configure, and use Grafana within containerized environments.
Note:While there are many other open source container tools you can use alongside Grafana, we only have official documentation related to Docker, Kubernetes, and Helm Charts at this time.
Each of our guides covers the most important topics identified by our open source community. Let’s take a closer look.
Docker
For Docker, we offer an end-to-end guide on how to deploy Grafana using Docker on any operating system. The guide is applicable to both Grafana Enterprise and Grafana OSS users. It explains how to use the docker run command as a quick way to get started, and how to use the docker compose command to create a specialized configuration YAML file for a larger deployment.
In addition, the guide covers:
- How to customize the default configuration to, for example, install a plugin, change the default server path, or troubleshoot the deployment.
- How to create a Docker volume to keep data persistent, along with guidance on other storage options based on your specific application use case, such as bind mounts.
- How to build a custom Grafana Docker image for running containers in complex environments.

Kubernetes
Grafana Labs’ documentation on how to deploy Grafana on Kubernetes is applicable to those who use a managed Kubernetes service — such as those from AWS, GCP, or Microsoft Azure — as well as those who run Kubernetes locally, including with tools like minikube or k3s. Like our Docker resources, the documentation covers both Grafana Enterprise and Grafana OSS.
In our Kubernetes documentation, you will learn:
- Helpful command-line examples, e.g.
kubectl, for accessing the Grafana service using EXTERNAL-IP or Port Forwarding. - How to perform updates and rollbacks to minimize downtime when performing maintenance in your cluster environment.
- Provisioning guidelines to create an alert rule or integrate a data source plugin.
Lastly, as Kubernetes is a complex platform, there is a complete troubleshooting section that provides best practices to collect logs, increase logging levels, and perform tests with the dry-run command to detect any potential issues before going live in production.

Helm Charts
The Helm Charts documentation for Grafana is currently applicable to Grafana OSS users.
It provides detailed instructions with command-line examples for installing and configuring the Grafana Helm Chart, for both managed Kubernetes services or in a local development environment.
Our docs also offer:
- An in-depth section on how to customize the Grafana default configuration using the traditional Helm configuration file,
values.yaml. - Answers to commonly asked questions such as how to enable Simple Mail Transfer Protocol (SMTP), install a plugin, and change the storage type — all with command line examples.
- Troubleshooting best practices, including how to collect and (if required) increase the logging level to debug mode and reset login credentials.

Community contributions and the Grafana Champion program
Just as we do with our open source projects, we welcome our community members to provide feedback and contribute to our documentation.
That’s why, at the bottom of our docs pages, you will find a section that looks like this:
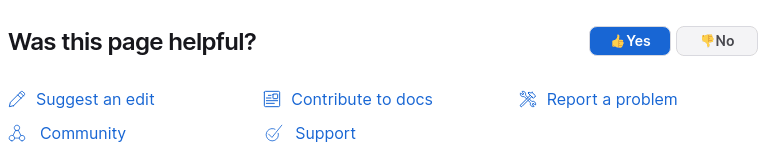
Here are some guidelines for submitting your feedback and reaching out:
- To make a small change via a PR, use Suggest an edit.
- To report a minor issue or mistake in the documentation, use Contribute to docs.
- To report a problem when viewing the documentation, use Report a problem.
- If you have questions after reading our documentation, you can ask them in our open source Community forum.
- For any other questions or requests, use the Support option.
Also, if you have experience using Grafana in a containerized environment and want to help others get started, we encourage you to apply for the Grafana Champions program!

We welcome program applications from everywhere in the world, and are also excited to hear from contributors from different demographics and underrepresented communities. Once you have completed the application, we’ll reach out as soon as possible.
Hope to hear from you soon!

