How to monitor metrics and logs from Altinity.Cloud in Grafana Cloud
Doug Tidwell is the Director of Content at Altinity, responsible for creating useful content for ClickHouse® users in general and Altinity customers in particular. He has more than 30 years of experience in databases, CI/CD systems, development tools, and middleware.
When it comes to visualizing, monitoring, and logging ClickHouse® clusters, there’s no easier way to accomplish all three than with Grafana Cloud, the open and composable observability stack powered by open source.
Altinity.Cloud is a platform that makes it easy to create, manage, and maintain ClickHouse clusters in public or private clouds. Altinity.Cloud comes with built-in monitoring that is completely compatible with Grafana hosted services like Prometheus and Loki. That makes it easy to use Grafana Cloud to visualize your ClickHouse data through Prometheus metrics and Loki logs.
In this blog post, we’ll go through the steps for how to:
- Set up a remote Prometheus service in Grafana Cloud
- Use the Altinity Cloud Manager (ACM) to connect ClickHouse clusters to the remote Prometheus service
- Use Grafana Cloud to visualize the data ClickHouse is sending to Prometheus
- Set up a remote Loki service in Grafana Cloud
- Use the ACM to connect ClickHouse clusters to the remote Loki service
- Use Grafana Cloud to see the data ClickHouse is sending to Loki
How to set up a remote Prometheus service in Grafana Cloud
Setting up a Prometheus service in Grafana Cloud is easy. Log in to your Grafana Cloud account. (If you don’t have one already, create a free one. Seriously.) Click the Grafana menu in the upper left corner, then select the Connections menu:

On the Add new connection page, enter hosted prometheus as the connection type. You’ll see the tile for Hosted Prometheus metrics:
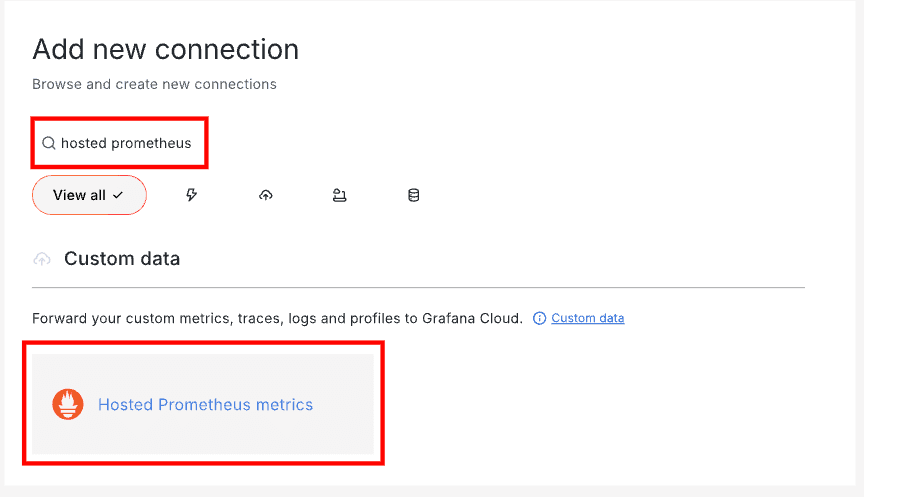
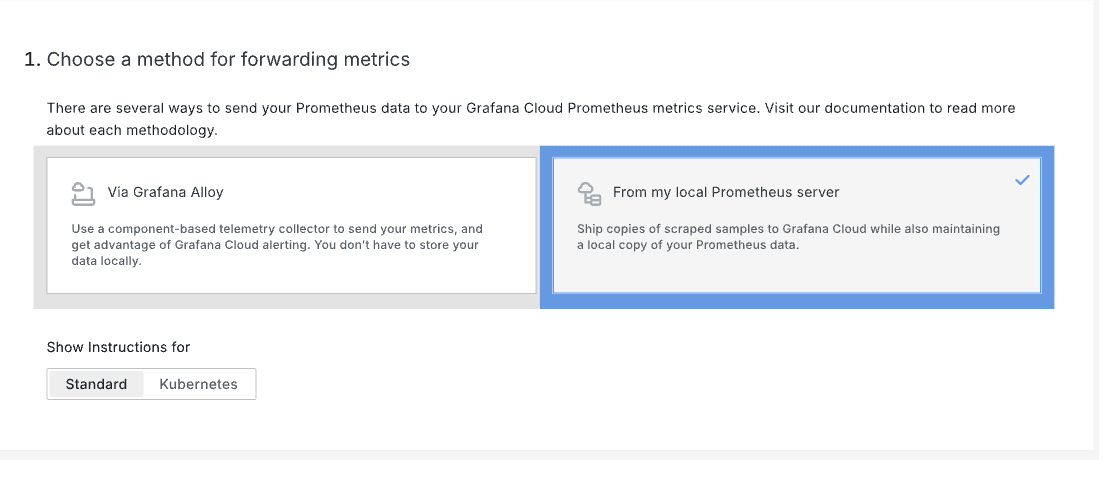
Click the Hosted Prometheus metrics tile. On the Hosted Prometheus metrics page, select From my local Prometheus server in section 1:
In section 2, select Send metrics from a single Prometheus instance:

Next, create a token for the Prometheus server in section 3. First give your token a name; this example uses ch-to-prometheus-at-grafana:

With the token name defined, click the Create token button. You’ll see something like this:

Grafana Cloud generates YAML that should go into the Prometheus configuration. Fortunately, the ACM makes it easy to configure the connection between an Altinity.Cloud environment and the external Prometheus server. As you probably guessed, we need values from the YAML snippet above: The url field and the username and password fields in the basic_auth section. We also need the name of the Grafana data source for our new Prometheus server. That data source will be named grafana-[accountname]-prom. For this example, that’s grafana-dougtidwell-prom.
Now it’s time to configure the Altinity.Cloud environment.
How to connect Altinity.Cloud to the remote Prometheus service in Grafana Cloud
To connect your Altinity.Cloud environment to an external Prometheus server, go to the list of environments in the ACM and click the vertical dots icon and select Edit from the menu:

In the Environment Configuration dialog, go to the Metrics tab and fill in the details of your external Prometheus server in the External Prometheus section:

Click OK to establish the connection. The ACM will now send metrics data to the external Prometheus server.
How to use Grafana Cloud to visualize Prometheus data
Whether metrics from your Altinity.Cloud environment are being sent to a Prometheus server or a Prometheus server is scraping metrics from your environment, we want to explore that data. Grafana Cloud makes it easy to do that. We simply need to explore the Prometheus data source (grafana-dougtidwell-prom in this example).
Go to the Grafana menu, then select the Metrics menu:

The Metrics page lets you look at the metrics from your Altinity.Cloud environment without writing PromQL queries. Click the New metric exploration button to explore a new set of metrics. When you do, you’ll see a list of all your Prometheus data sources:

We’ll select the grafanacloud-dougtidwell-prom server and we see a dashboard full of useful metrics:

The initial display includes metrics such as Apiserver_request_total, which is a counter of apiserver requests broken out for each verb, HTTP response code and other categories, and Clickhouse_operator_pod_add_events, which is a counter of the number of Kubernetes pods added while the Altinity Kubernetes Operator for ClickHouse is running.
Each visualization is labeled with the name of the metric itself. Mousing over the circled i shows more information about a particular graph:

Every metric sent to the Prometheus server has one or more labels attached to it. We can filter what we see by selecting one or more labels. Click the Add label button to add a label to the query. When you click the button, you’ll see a dropdown list of labels from all the metrics sent to this server:

With a label selected, you’ll get a dropdown list of all the values for that label:

(The Altinity.Cloud environment we’re using here contains ClickHouse clusters named maddie-na and testms.)
The page is filtered to show only visualizations of data tagged with the label and value you selected. In this example, that means everything with a label of clickhouse_altinity_com_chi and a value of maddie-na:

So now we’ve successfully created a Prometheus server and connected it to your ClickHouse clusters. Now we’ll turn our attention to Loki…
How to set up a hosted logs service in Grafana Cloud
Metrics are useful for understanding the overall health of your system, but when we need to dig deeper we need logs. For that we’ll configure your hosted logs server in Grafana Cloud, which is powered by the open source log aggregation tool Grafana Loki. First, go to the Grafana menu in the upper left corner and select the Connections menu as shown above in Figure 1.
On the Add new connection page, enter hosted logs as the connection type. You’ll see the tile for Hosted Loki:
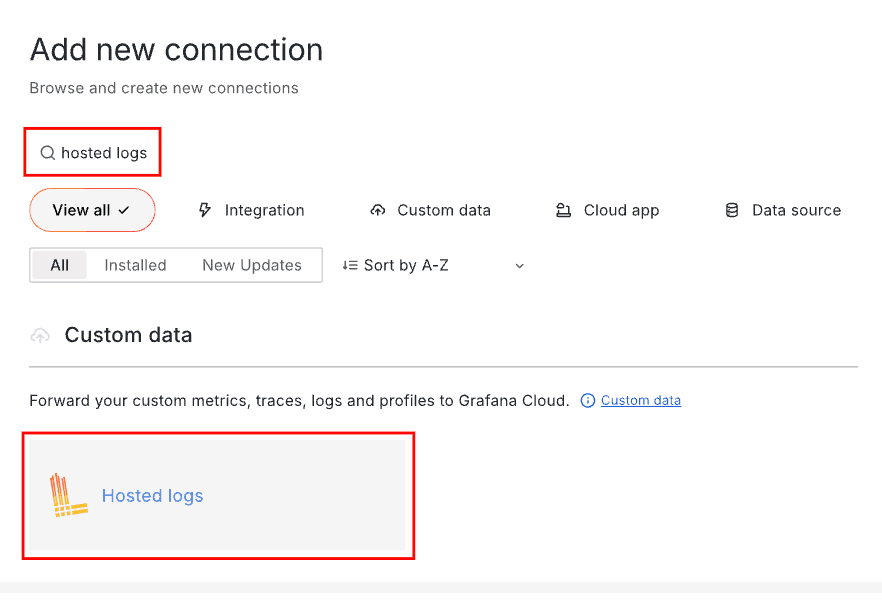
Click the Hosted logs tile. On the Hosted logs page, select Send logs from a standalone host in section 1:

Next, create a token for the Loki server in section 2. First, give your token a name; this example uses ch-to-loki-at-grafana:

With the token name defined, click the Create token button. You’ll see something like this:

Typically using an external Loki server would involve using the promtail agent to send the local ClickHouse logs to a Loki server. In creating the new token, Grafana generated a YAML file to configure promtail. Fortunately, promtail is deployed by Altinity.Cloud in the altinity-cloud-system namespace:
kubectl get pods --namespace altinity-cloud-system | grep promtail
promtail-4kgcx                1/1     Running            0            2d4h
promtail-4lgb7                1/1     Running            0            100m
promtail-7wm8b                1/1     Running            0            3d22h
promtail-d2n5g                1/1     Running            0            3d21h
promtail-mj6qv                1/1     Running            0            3d22h
The one piece of information we need from the YAML file is the value of the URL as highlighted in Figure 19 above. Enter that value in the External Loki URL field of the Logs tab of the Environment Configuration dialog. (See Figure 20 below.) Once the URL is defined in the ACM, promtail is automatically configured.
Now it’s time to configure your external Loki server in the ACM.
How to connect Altinity.Cloud to the hosted logs service in Grafana Cloud
Integrating Loki with your ClickHouse clusters is done at the environment level in the ACM. To connect your environment to an external Loki server, go to the list of environments in the ACM and click the vertical dots icon and select Edit from the menu as shown in Figure 7 above. You’ll see the Environment Configuration dialog; go to the Logs tab:

In the External Loki URL field, enter the URL of your external Loki server in the format https://username:password@lokiurl.com/api/prom/push. The URL, username, and password come from the YAML file generated by Grafana Cloud above. You need to include your username and password as part of the URL, and use the endpoint /api/prom/push to access the Loki API.
Click OK to save your settings. Log messages are now being sent from your ClickHouse cluster to your remote Loki server.
How to use Grafana Cloud to visualize log data
With your Loki server set up, let’s take a look at the data the ACM is sending from your ClickHouse clusters. Go to the Grafana menu in the upper left and click the Data sources menu:

When the list of data sources appears, you’ll see a tile for each data source. One or more of them will have the Loki logo. The one we’re looking for will be named grafanacloud-[accountname]-logs:

Click the Explore button to open the data source:

Log messages in Loki consist of a timestamp, some number of labels (name/value pairs), and the text of the message. Click the Label browser button to see the labels available on your Loki server:

Here we’ve selected a couple of labels: namespace and pod. When selecting a label in section 1, the display in section 2 displays the available values for each label. Furthermore, as you select specific values in section 2, the available values under the other labels change. As an example, clicking on the value altinity-maddie-na under the label namespace removes all of the values under the pod label except for clickhouse-operator-7778d7cfb6-9q8ml. Selecting those two values changes the LogQL selector in section 3 to match:
{namespace="altinity-maddie-na",pod="clickhouse-operator-7778d7cfb6-9q8ml"}
To see the logs that match this selector, click the Show Logs button. You’ll see all the matching messages from the Loki server:
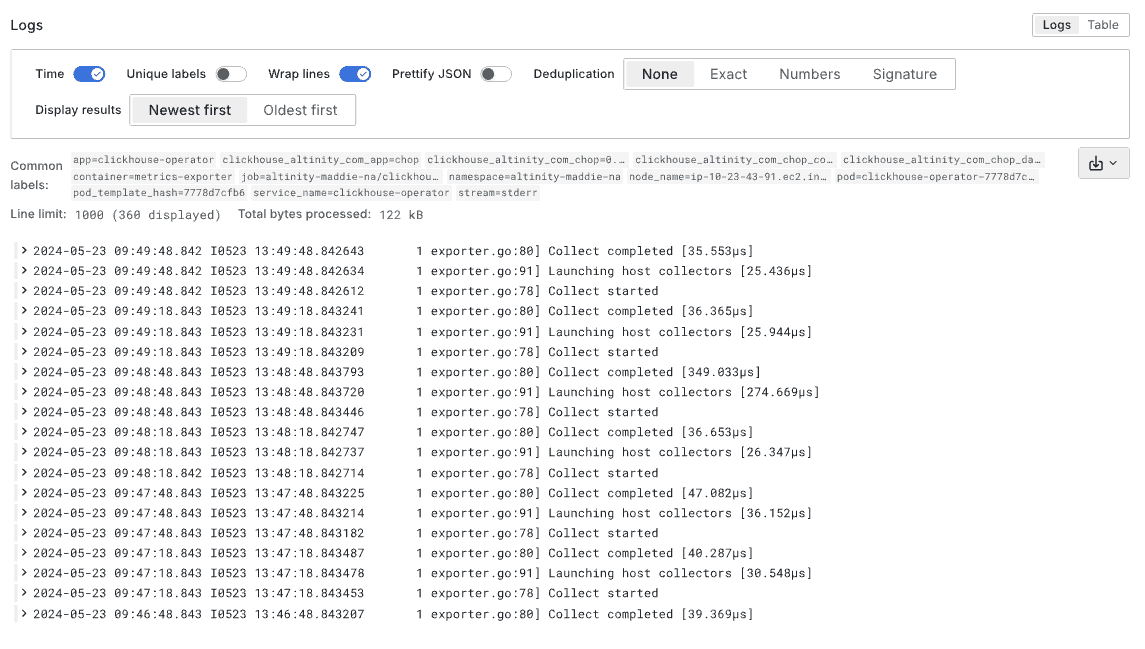
The display also includes a graph of how many log messages have been issued over time:

So now we’ve configured a hosted Prometheus server and a hosted Loki server in Grafana Cloud, and we’ve used the ACM to connect ClickHouse clusters to the respective services so we can visualize metrics and logs in a Grafana dashboard.
Learn more about Grafana Cloud and Altinity
Grafana Labs follows a “big tent” philosophy, which allows organizations to own their observability strategy, have the freedom to choose their own tools, and have the ability to bring all their data together in one view, no matter where it lives. Whether you set up monitoring Altinity.Cloud with the built-in open source tools or you leverage the out-of-the-box Grafana Cloud solution for your ClickHouse clusters, you can learn more about how Grafana Cloud brings together all your data in one platform in the Grafana Cloud documentation.
However you want to run ClickHouse, Altinity has the support you need to add low cost, open source real-time analytics to your applications. Our philosophy is that open source is a superior approach to developing software, and we advocate for its adoption across the modern data stack. See the Altinity.Cloud documentation for all the details of connecting your ClickHouse clusters to Grafana Cloud, Prometheus, and Loki.
Grafana Cloudis the easiest way to get started with metrics, logs, traces, dashboards, and more. We have a generous forever-free tier and plans for every use case. Sign up for free now!
