
How to set up an open source database monitoring stack with Grafana Cloud
One of the great powers of Grafana is the open source community behind it — a community that provides a breadth of ready-to-use dashboards, plugins, exporters, and instructions that make a million tasks easier. The sheer scale of it all means whatever you need probably already exists somewhere.
To illustrate this, I want to share an example of how to use these tools as a base for building a comprehensive database monitoring solution.
This is a popular use case because proprietary monitoring tools are often expensive and inflexible. This results in organizations limiting access to these tools when more stakeholders could benefit from their use. But by combining Prometheus and Grafana Cloud, you can build an ideal replacement as they are both extraordinarily flexible and free.
Addressing a real-world database observability issue
Recently, I had the opportunity to show an organization how to combine Grafana and Prometheus to gain insight into the performance of their Oracle database. The main stakeholder was a senior vice president who needed to monitor the data layer of their most profitable software product.
Since they deliver software as a service to the financial services industry, they need every transaction to happen at high speed. They previously used a closed-source tool to gather and visualize performance information about their database, in particular information about performance and long-running queries. They had a proprietary agent deployed alongside Oracle and visualized the data in a legacy tool with an inflexible front end. They needed to move off this solution due to cost constraints and lack of flexibility. As Grafana and Prometheus users already, they were perfectly positioned to leverage these tools for Oracle database observability.
We started our search for a solution using Grafana Alloy and Grafana Cloud. We needed something that was flexible enough to let us create the views we needed but also quick and easy to get started with. For the remainder of this blog, we’ll recreate what I did for that user so you can follow along and build your own open source database monitoring stack.
How to pair Alloy and Grafana to monitor Oracle
Grafana Alloy is an open source, vendor-neutral distribution of the OpenTelemetry (OTel) Collector. Alloy uniquely combines the very best OSS observability signals in the community and is fully compatible with the OTel Collector, Prometheus Agent, and Promtail. In addition, Alloy embeds a wide range of Prometheus collectors. This includes the community open source OracleDB exporter, which makes it easier to get started since we can deploy a single binary to collect all the relevant signals.
Grafana Cloud is our cost effective, flexible SaaS offering that’s capable of delivering quick time to value. Grafana Cloud will act as both our datastore and our visualization/alerting solution. Using the forever-free tier lets me iterate quickly without needing to spin up my own metric store and front-end visualization layer of Grafana. I can simply follow the quick start instructions to deploy Alloy and start sending Oracle metrics to the cloud.
What’s in the box: initial iteration
Grafana Cloud makes getting the first iteration up and running a breeze. I just need to navigate to Home > Connections > Add new connection > OracleDB and then click Configuration Details to get a full set of simple instructions to follow that require a few straightforward steps.

- Install Grafana Alloy. The interface will lead you through a few interactive selections and generate a single command to run on your target system, which in my case is a CentOS system.
- Make configuration selections. Here you will be asked to decide if you would like to gather extended metrics and if you’d like to send logs. Since I was trying to figure out exactly what was possible, I decided to turn both on. However, I would generally suggest you only turn on the base metrics to begin with and expand from there, if necessary. The decision comes down to cost. Every metric has a real dollar value and it is important to only collect metrics that you will use.
- Prepare our configuration file (and prepare our target database). At this stage, Grafana Cloud provides commands you can copy and paste into Oracle to create a user. Grafana Alloy can then connect that user to Grafana Cloud, and it provides a ready-to-use configuration block you can simply add to your existing Grafana Alloy configuration from step 1.
- Restart Grafana Alloy and test configurations. The last step is to simply restart Grafana Alloy and test the connection.

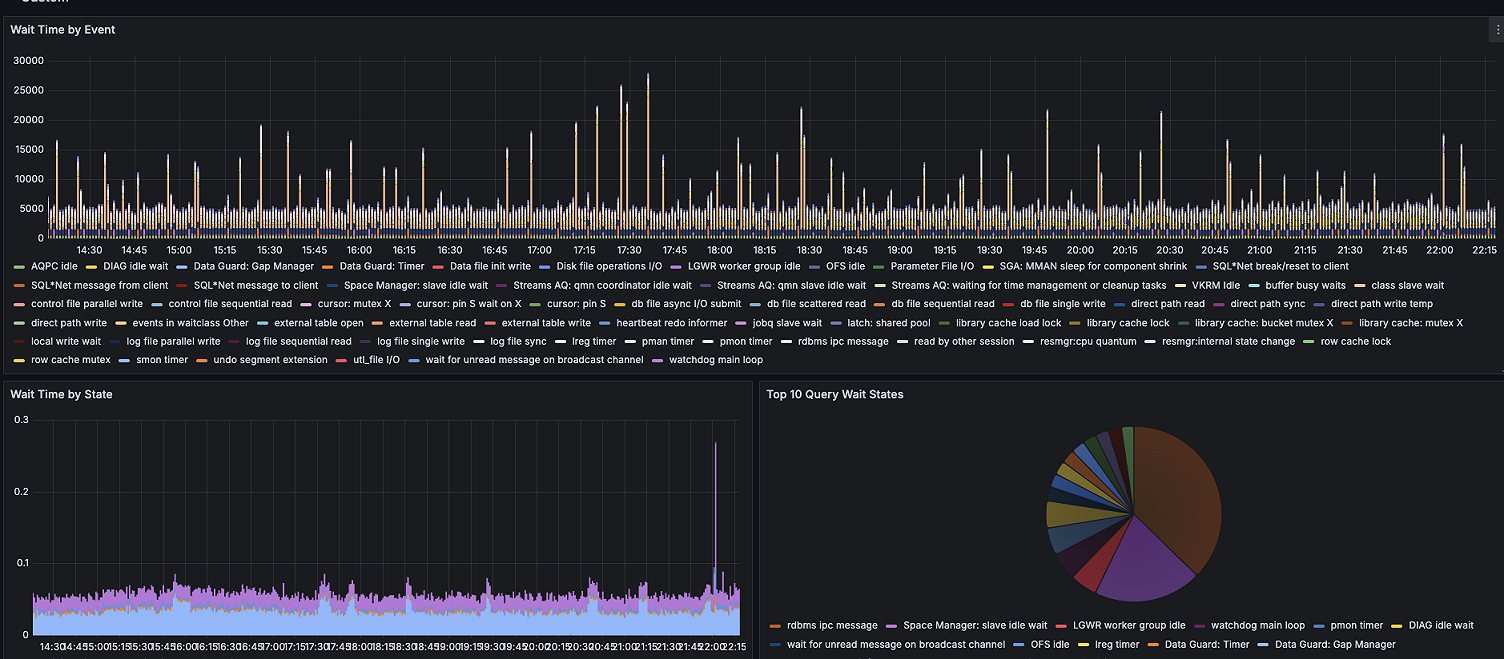
With this work done, metrics and logs are flowing into Grafana Cloud from my OracleDB and I can view the out-of-the-box dashboards.

As pictured above, the integration provides many useful views of important system metrics like number of open sessions, number of processes, and wait time information, among other information.
Outside the box: subsequent iteration
While the first iteration immediately demonstrated the power of Grafana to deliver value in a short period of time and proved it was a capable solution, we are now free to iterate on that design to deliver flexibility as well. I would recommend following this pattern as the base metrics provide an excellent out-of-the-box experience. Additional queries and metrics can certainly be defined if necessary, but understanding the base capabilities should be your first priority.
The first iteration’s architecture relied on the embedded OracleDB exporter to extract metrics from the Oracle database. The embedded exporter, however, does not allow for the inclusion of custom defined metrics; it simply exports a fixed list of metrics as shown here: OracleDB integration | Grafana Cloud documentation.
For more detailed performance data, we need to use the upstream OracleDB exporter to gain the flexibility to define our own custom Oracle queries that yield our own custom metrics. Grafana’s commitment to delivering an open and composable solution means that it is easy for me to simply turn off embedded OracleDB exporter and instead deploy the upstream exporter and configure Alloy to scrape the metrics from its endpoint.
To deploy the upstream exporter, visit https://github.com/iamseth/oracledb_exporter/ to pull down the most recent release. We can then place the exporter alongside Alloy and configure it following the instructions from the GitHub repo.

With this updated architecture, we were then able to define our own custom metrics in a simple yaml file. For example, we can define four metrics with one block like this.
    metrics:
    - context: "tablespace_capacity"
      labels: ["tablespace"]
      metricsdesc:
        used_value: "Gauge amount used"
        free_value: "Gauge amount free"
        total_value: "Gauge total amount"
        pfree_value: "Gauge percentage free"
      request: "SELECT fs.tablespace_name                tbspcname,
           ( df.totalspace - fs.freespace )              used_value,
           fs.freespace                                  free_value,
           df.totalspace                                 total_value,
           Round(100 * ( fs.freespace / df.totalspace )) pfree_value
        FROM   (SELECT tablespace_name,
                   Round(Sum(bytes) / 1048576) totalspace
            FROM   dba_data_files
            GROUP  BY tablespace_name) df,
           (SELECT tablespace_name,
                   Round(Sum(bytes) / 1048576) freespace
            FROM   dba_free_space
            GROUP  BY tablespace_name) fs
        WHERE  df.tablespace_name = fs.tablespace_name"
And we can define another important needed metric like this.
    - context: "cache_hit_ratio"
      metricsdesc:
        percentage: "Gauge metric with the cache hit ratio."
      request: "select
        Round((
        (Sum(Decode(a.name, 'consistent gets', a.value, 0))
          + Sum(Decode(a.name, 'db block gets', a.value, 0))
          - Sum(Decode(a.name, 'physical reads', a.value, 0))
        )/
        (Sum(Decode(a.name, 'consistent gets', a.value, 0))
          + Sum(Decode(a.name, 'db block gets', a.value, 0)))) *100,2) as percentage
        FROM v$sysstat a"
This new architecture gives us the exact flexibility we need to deliver the custom dashboards required.


Going quickly from idea to solution
Combining the speed and power of Grafana Cloud with the breadth and depth of the open source community allows users to quickly deliver observability to a wide range of platforms. In this case, I was able to go from idea to solution in a matter of hours and deliver a powerful solution that met the business requirements.
I strongly believe that Grafana and Prometheus together can deliver the database monitoring capabilities needed. Plus, Grafana Cloud’s free tier makes getting started easy, as we’ve has wrapped this all up into easy to follow instructions built directly into the product. If you have any questions, feel free to ask me in the Grafana Community Slack.
Grafana Cloud is the easiest way to get started with metrics, logs, traces, dashboards, and more. We have a generous forever-free tier and plans for every use case. Sign up for free now!


