
The new, queryless UI for Grafana Pyroscope: Introducing Explore Profiles
Note: As of Feb. 20, 2025, the Explore apps (Explore Metrics, Explore Logs, Explore Traces, Explore Profiles) are now the Drilldown apps (Metrics Drilldown, Logs Drilldown, Traces Drilldown, Profiles Drilldown).
Note: We updated this post to clarify that the Explore Profiles app (now Profiles Drilldown) is not available in Grafana Cloud yet. We will update this post again when it will be available.
We are excited to share a significant update for Grafana Pyroscope users and the broader open source community: the launch of Explore Profiles, a new OSS application that makes it easier and faster to surface meaningful insights from your profiling data.
Explore Profiles is a Grafana app plugin designed to integrate seamlessly with Grafana Pyroscope, the open source continuous profiling backend, providing a smooth, queryless experience to browse and analyze your profiling data. It’s part of our growing suite of Explore apps — alongside Explore Metrics and Explore Logs — which empowers you to derive value from your data without having to use complex query languages.
In this post, we’ll take a closer look at Explore Profiles, its key features, and how to start using the app today to visualize service performance, quickly diagnose issues, and more.

First, some background
Initially, the Pyroscope UI was designed as a standalone interface, well-suited for analyzing performance data and finding root causes. But when Pyroscope joined Grafana Labs last year, our ambitions grew: we wanted to integrate profiling with other telemetry data, such as logs, metrics, and traces. We also wanted to drive integrations between Pyroscope and Grafana k6 for load testing, AI/ML features, and other powerful solutions that already existed within the Grafana ecosystem.
Over the past year, we’ve released several features that help users combine profiling with other types of telemetry data and tools to achieve deeper insights into system performance. These updates include:
- Span Profiles: Representing a major shift in profiling methodology, this feature combines tracing and profiling data to offer span-level profiles, and enables dynamic analysis of specific execution scopes within applications.
- Flame graph AI: This feature uses Grafana’s large-language model (LLM) plugin to offer AI-based analysis of flame graphs and recommendations to fix performance issues.
- k6 performance profiles: This feature uses Pyroscope alongside Grafana k6 to link load tests with their resulting performance profiles.
Now, the Explore Profiles app marks the latest evolution of Grafana Pyroscope, delivering a new UI that allows users to browse and analyze their profiling data more seamlessly and intuitively than ever before.
Key features of Explore Profiles
With the Explore Profiles app, we offer a more accessible and flexible tool for all our users, making it easier to visualize, analyze, and manage your profiling data. Since Explore Profiles is also open source, you can contribute and request new features or even customize the app for specific use cases.
Some of the key features of Explore Profiles include:
- Enhanced user experience: A more intuitive and user-friendly interface allows you to quickly analyze and derive value from your profiling data — again, all without having to write complex queries.
- Performance optimization: Easily identify processes or services that you can optimize for better performance.
- A high-level view of service performance: Get a broad view of all of your services and how they’re functioning, along with the ability to drill down for more targeted root cause analysis.
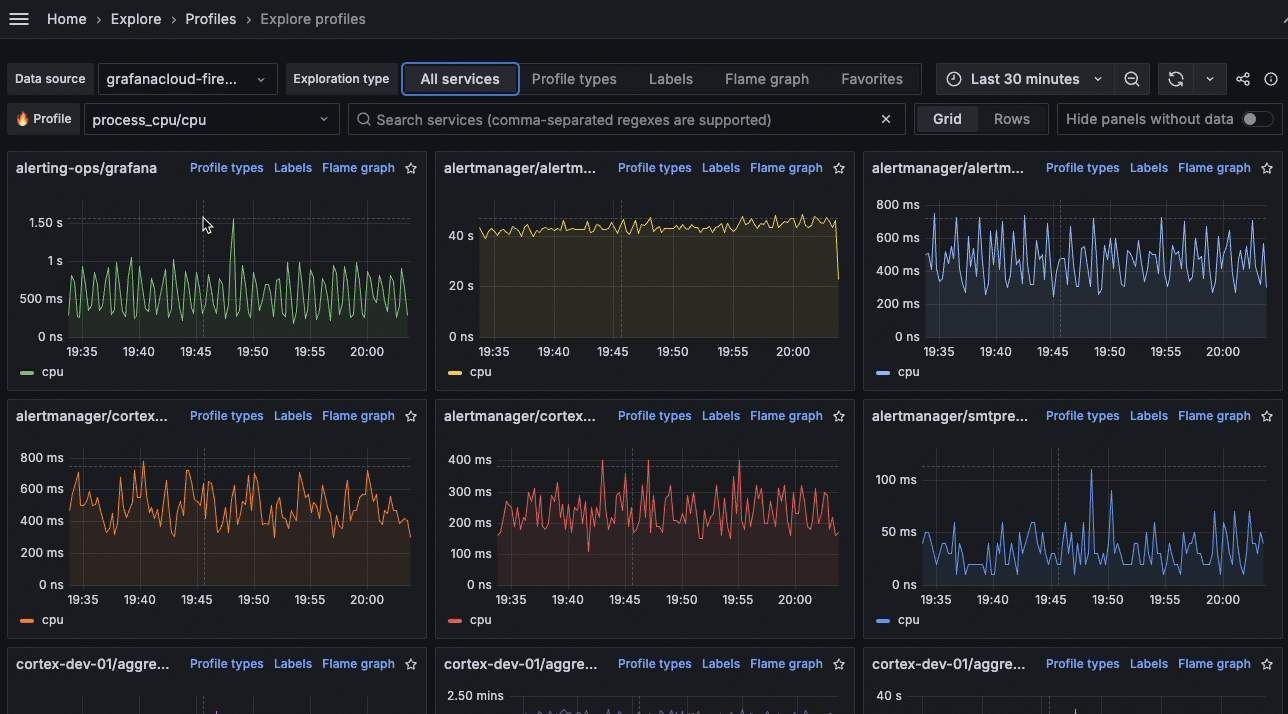
Explore Profiles helps you to investigate issues and determine root causes using key profiling concepts, such as profile types, labels, and flame graphs. Profile types offer insights into different dimensions of application performance, such as CPU usage or memory allocation, while labels identify specific components within your profiling data, such as Kubernetes pod names and namespaces. These labels help you analyze the behavior of different application segments under different conditions — an essential capability to identify performance anomalies.
Flame graphs provide a clear, intuitive way to visualize resource allocation and performance bottlenecks, and Explore Profiles takes this one step further, leveraging the Grafana LLM plugin to offer recommendations and performance fixes for you.

In addition, integration with Span Profiles lets you see performance characteristics grouped by trace span, making it easy to debug endpoint latency and performance directly from the Explore Profiles UI.

To learn more about Explore Profiles features and the UI, check out our technical docs.
How to get started with Explore Profiles
Explore Profiles is distributed as a Grafana application plugin, and you can find it in the official Grafana plugin catalog. We plan to roll out Explore Profiles in Grafana Cloud in the coming months.
Installation in a self-hosted Grafana instance
You can install the Explore Profiles plugin in your own Grafana instance using grafana-cli:
grafana-cli plugins install grafana-pyroscope-app
Alternatively, you can install using the Grafana UI by following these steps:
- Within Grafana, go to Administration > Plugins and data > Plugins.
- Search for Explore Profiles.
- Click on Explore Profiles.
- Click on Install.
For more information, chec out the new Explore Profiles GitHub repo.
We want to hear from you!
We invite you to join our growing community of users and contributors; your feedback, suggestions, and contributions are invaluable in making Grafana Pyroscope — and now Explore Profiles — the best it can be. Head over to the Explore Profiles GitHub repository to explore the code, contribute, and provide feedback.
Thank you for your continued support. We look forward to seeing the innovative ways you will use the new Explore Profiles app!
Grafana Cloud is the easiest way to get started with continuous profiling, metrics, logs, traces, and dashboards. We have a generous forever-free tier and plans for every use case. Sign up for free now!

